Foresight
Documentation for Foresight; a Makie theme and some utilities.
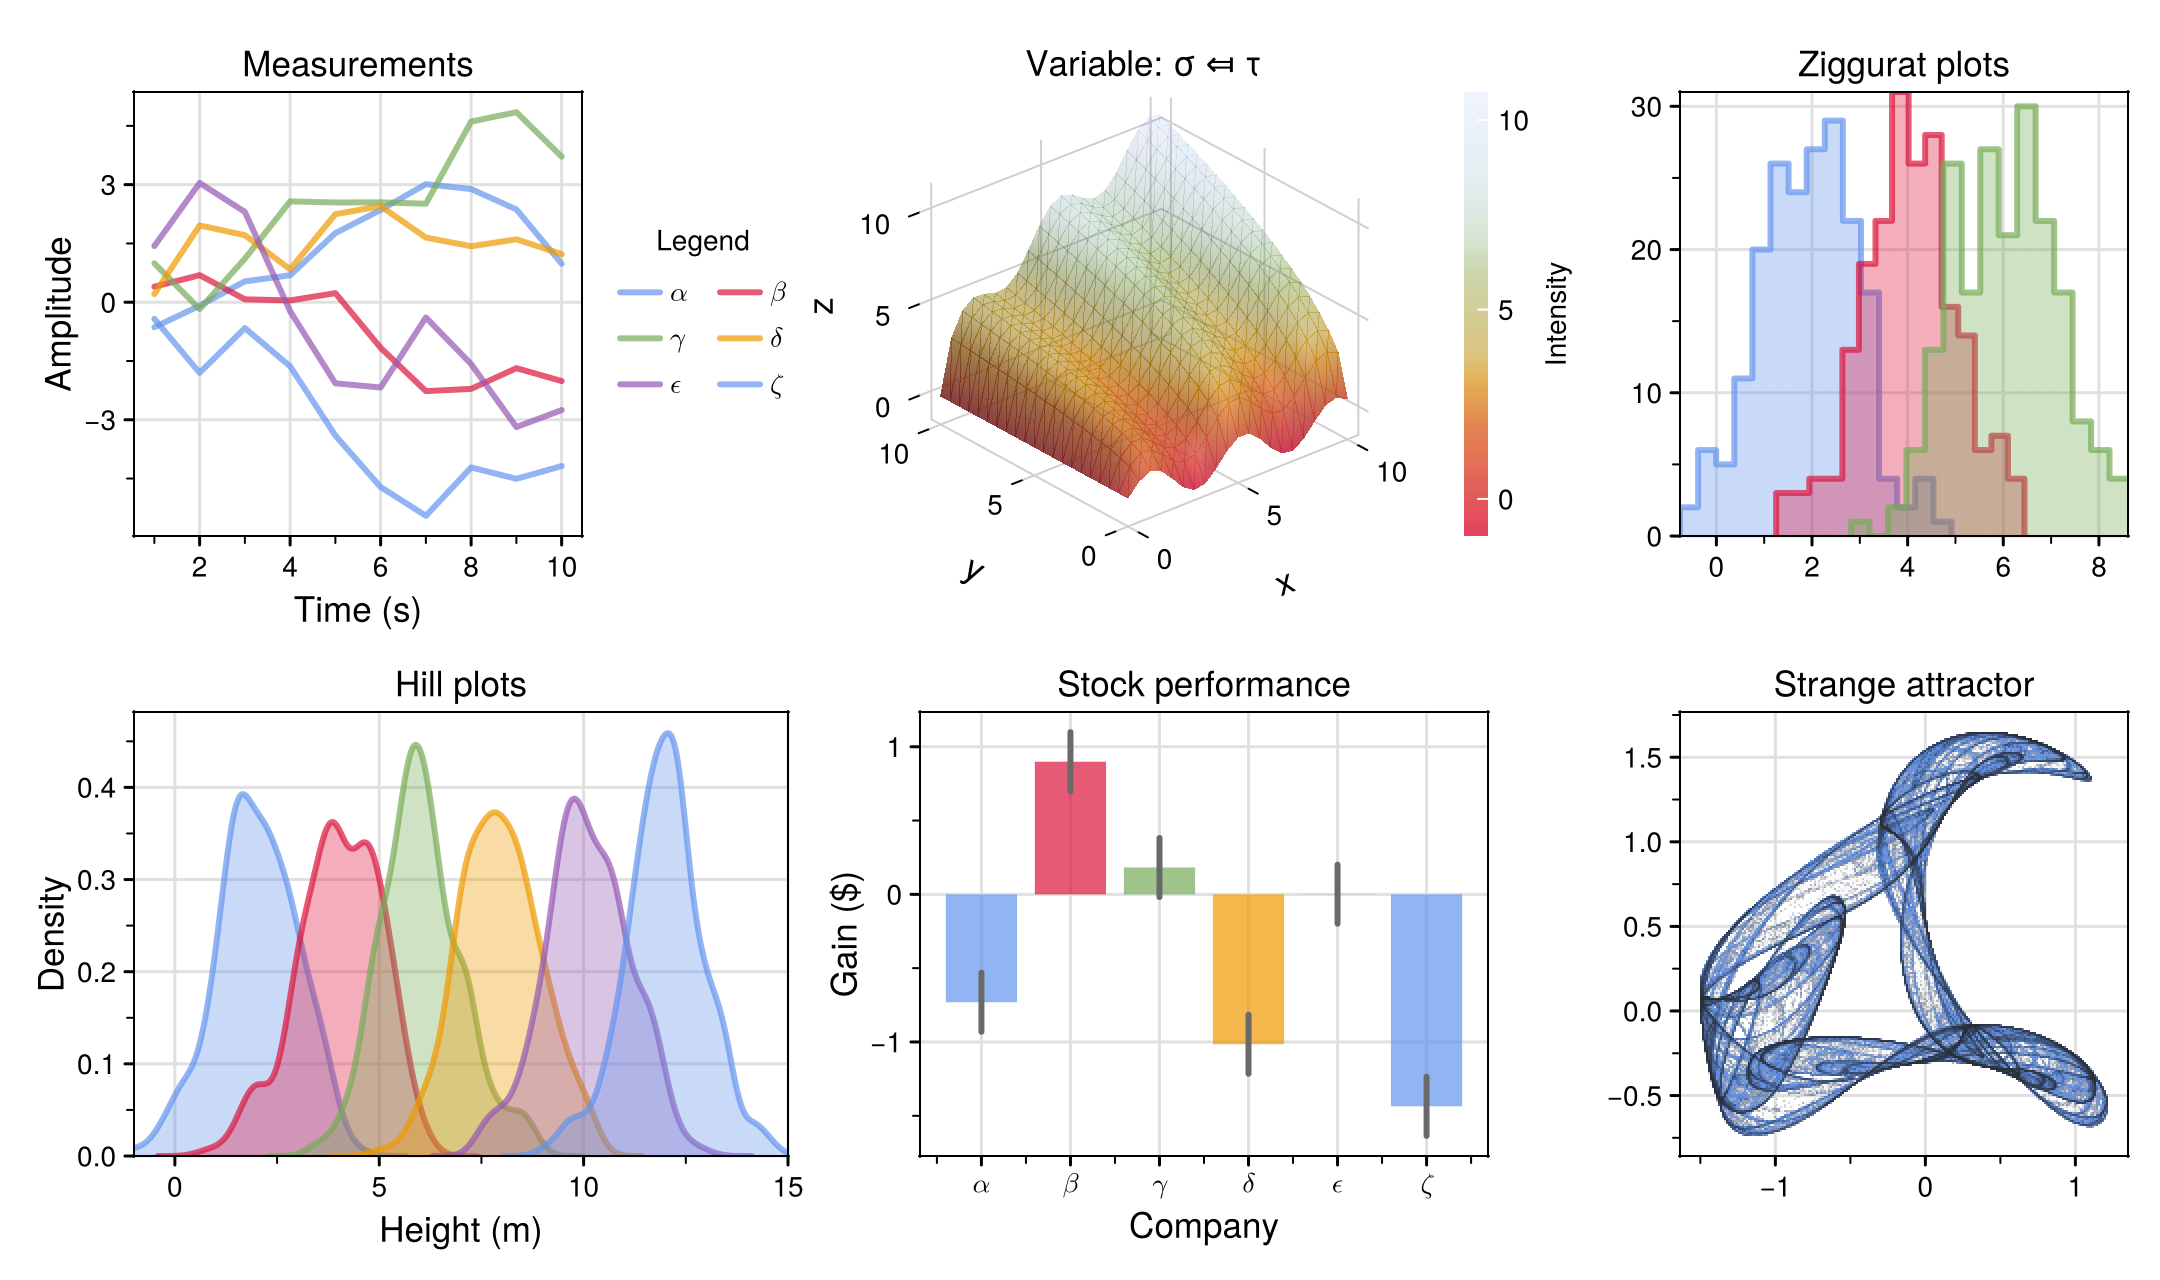
Default theme
julia
using CairoMakie
using Foresight
foresight() |> Makie.set_theme!
fig = Foresight.demofigure()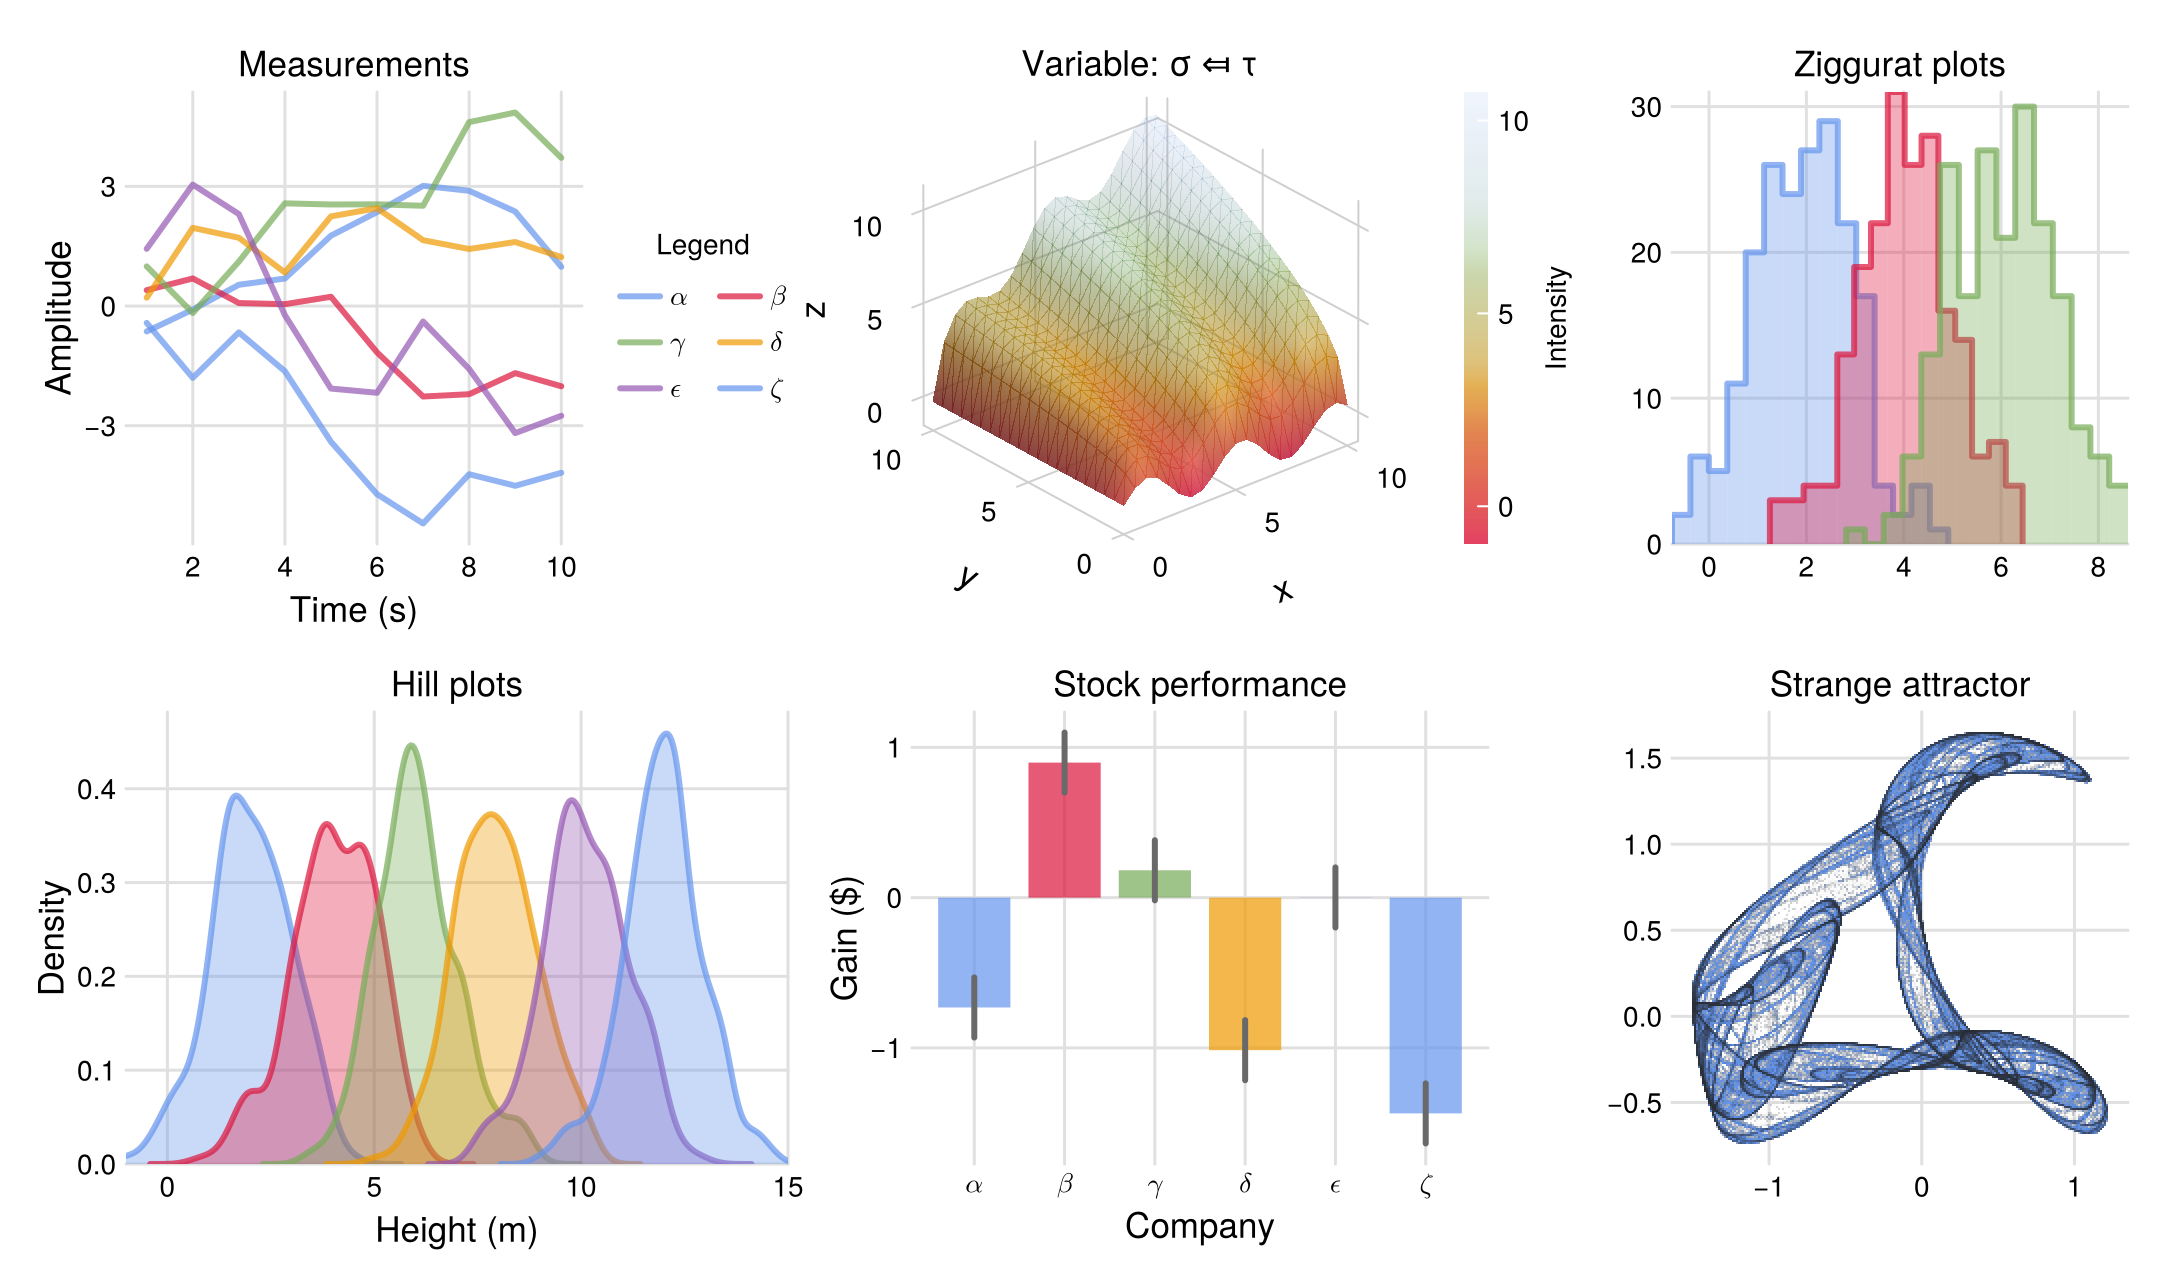
Theme options
Any combination of the keywords below can be used to customise the theme.
Dark
julia
foresight(:dark, :transparent) |> Makie.set_theme!
fig = Foresight.demofigure()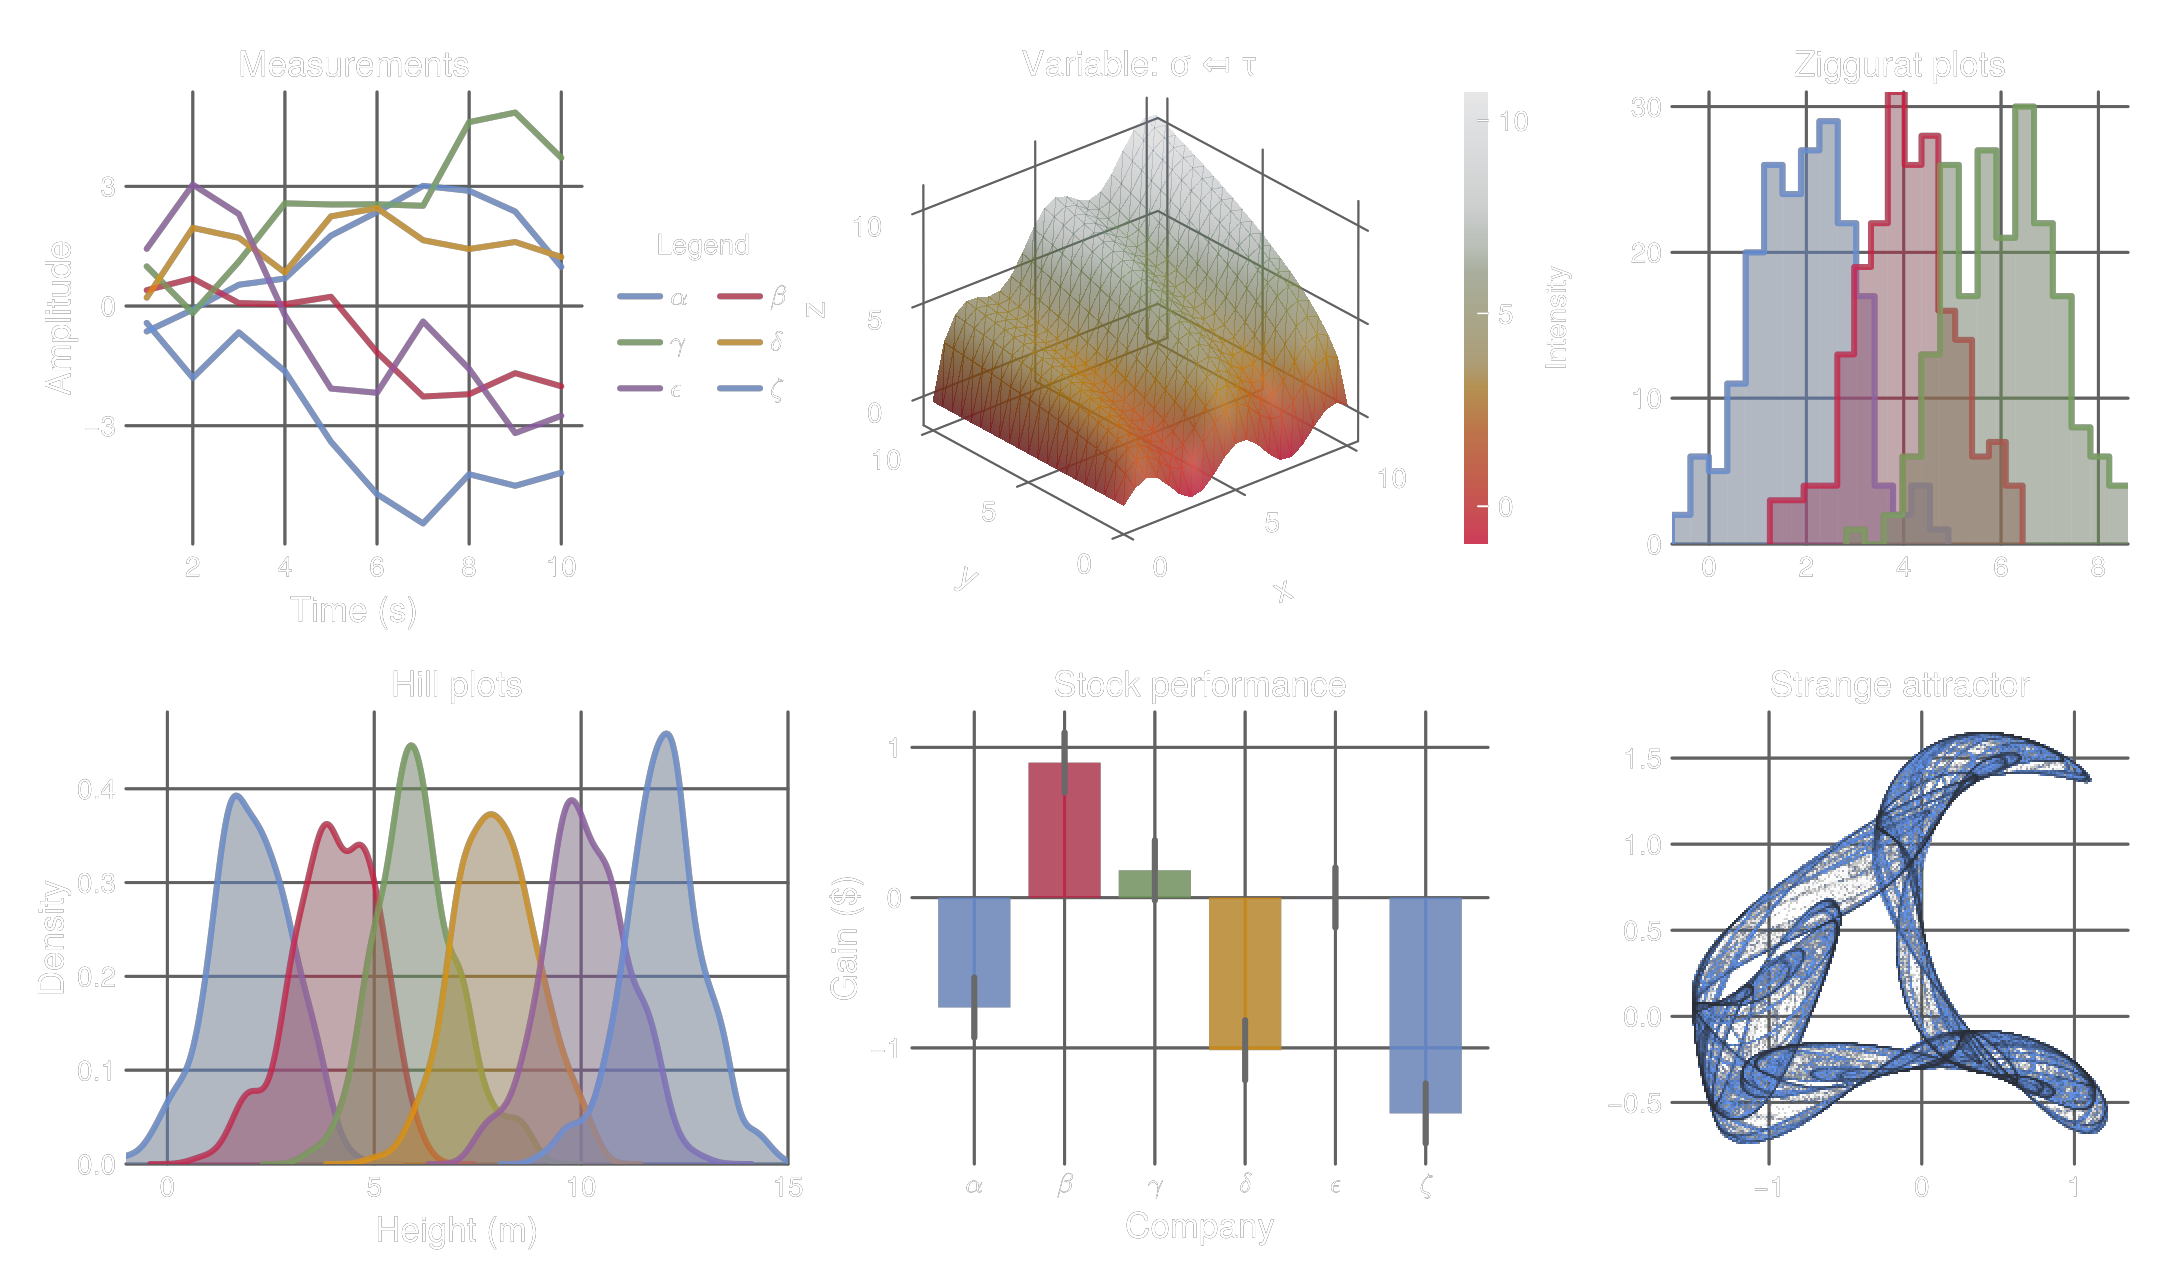
Transparent
julia
foresight(:dark, :transparent) |> Makie.set_theme!
fig = Foresight.demofigure()
Serif
julia
foresight(:serif) |> Makie.set_theme!
fig = Foresight.demofigure()
Physics
julia
foresight(:physics) |> Makie.set_theme!
fig = Foresight.demofigure()