Utilities
addlabels!
Add labels to a provided grid layout, automatically searching for blocks to label.
f = Foresight.demofigure()
addlabels!(f)
display(f)CairoMakie.Screen{IMAGE}Foresight.addlabels! Function
addlabels!(gridpositions, f::Figure, [text]; dims=2, kwargs...)Add labels to a provided grid layout. The labels are incremented in the linear order of the grid positions.
Arguments
gridpositions: An iterator ofGridPositions as produced by e.g.subdivide.f: The figure associated with the grid positions (optional)text: Text to be displayed in the labels, as either an interator of strings or a function applied to the integer indices of the grid positions [optional; defaults to (a), (b), ...]kwargs: Keyword arguments to be passed to theLabelfunction.
Examples
f = Figure()
gs = subdivide(f, 2, 2)
addlabels!(gs)
display(f)addlabels!(f::Figure, [text]; dims=2, allowedblocks = [Axis, Axis3, PolarAxis], recurse =
[GridContent, GridLayout], kwargs...)Add labels to a provided grid layout, automatically searching for blocks to label.
Arguments
f: The figure to add labels to.text: Text to be displayed in the labels, as either an interator of strings or a function applied to the integer indices of the grid positions [optional; defaults to (a), (b), ...]dims: The dimension to increment labels;1for top-to-bottom increases (column major), or2for right-to-left increases (row-major; default).allowedblocks: The types of blocks to consider for labelling (optional; defaults to[Axis, Axis3, PolarAxis]).recurse: The types of blocks to recurse into for searching theallowedblocks(optional; defaults to[GridContent, GridLayout]).kwargs: Keyword arguments to be passed to theLabelfunction.
Examples
f = Foresight.demofigure()
addlabels!(f)
display(f)
See also: addlabels!
seethrough
Converts a color gradient into a transparent version.
C = cgrad(:viridis)
transparent_gradient = seethrough(C)
Foresight.seethrough Function
seethrough(C::ContinuousColorGradient, start=0.0, stop=1.0)Convert a color gradient into a transparent version
Examples
C = sunrise;
transparent_gradient = seethrough(C)scientific
Generate string representation of a number in scientific notation with a specified number of significant digits.
scientific(1/123.456, 3) # "8.10 × 10⁻³""8.100 × 10⁻³"Foresight.scientific Function
scientific(x::Real, sigdigits=2)Generate string representation of a number in scientific notation with a specified number of significant digits.
Arguments
x::Real: The number to be formatted.sigdigits::Int=2: The number of significant digits to display.
Example
scientific(1/123.456, 2) # "8.10 × 10⁻³"There is also an lscientific method, which returns a LaTeX-style string:
lscientific(1/123.456, 3)"8.100\\times 10^{-3}"Foresight.lscientific Function
lscientific(x::Real, sigdigits=2)Return a string representation of a number in scientific notation with a specified number of significant digits. This is not a LaTeXString. See Lscientific
Example
x = lscientific(1/123.456, 2) # "8.10 \times 10^{-3}"
l = LaTeXString(x)As well as Lscientific, which returns a LaTeXString:
Lscientific(1/123.456, 3)8.100\times 10^
Foresight.Lscientific Function
lscientific(x::Real, sigdigits=2)Return a string representation of a number in scientific notation with a specified number of significant digits, as a LaTeXString. See lscientific
Example
x = Lscientific(1/123.456, 2) # L"8.10 \times 10^{-3}"tick formatting
Format tick labels to be as compact as possible:
lines(0:sqrt(2)/100:sqrt(2), sqrt; axis=(;xtickformat=terseticks))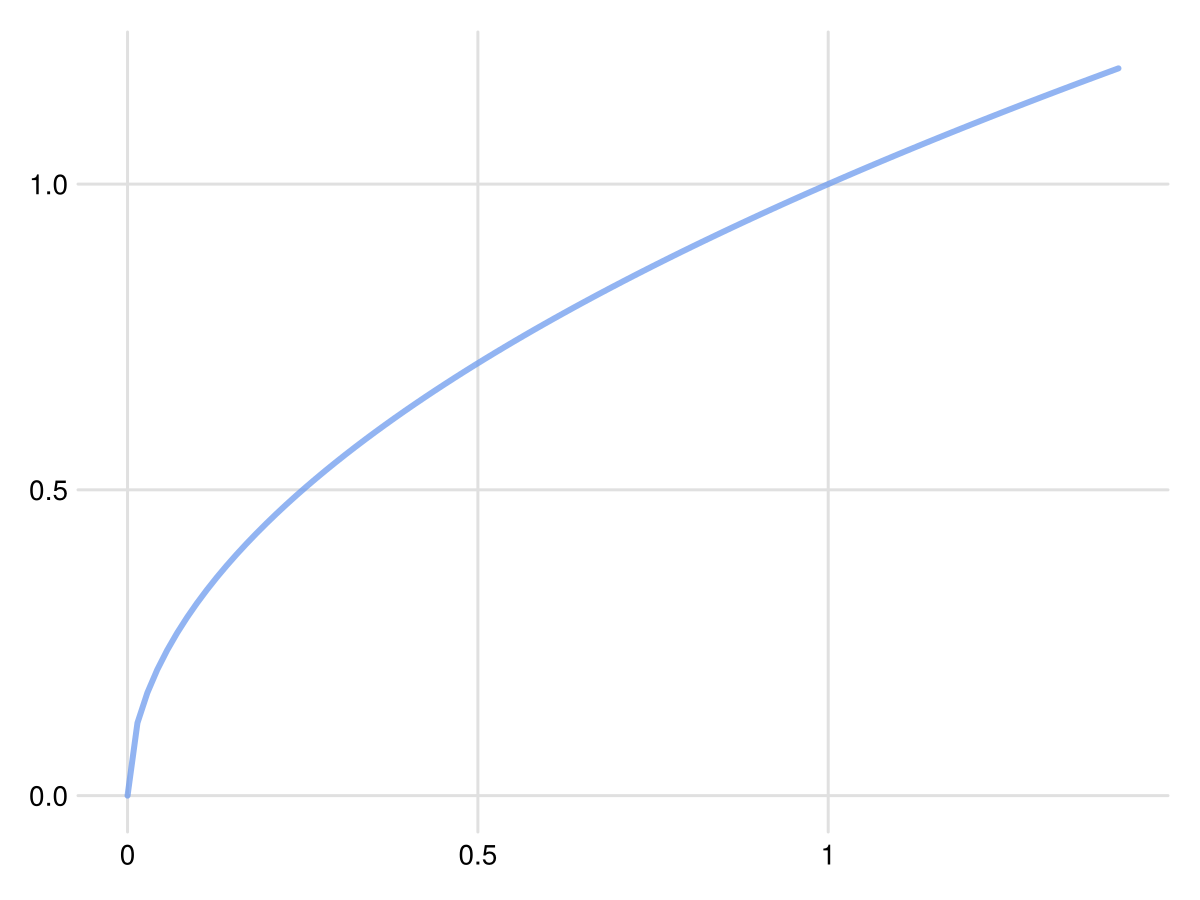
Foresight.terseticks Function
terseticks(x::Real; sigdigits=5, kwargs...)Return a string representation of a number x with trailing zeros removed, rounded to the specified number of significant digits. The kwargs argument is passed to the round function.
Or, format proportion values as percentages:
lines(0:0.01:1, sqrt; axis=(;xtickformat=percentageticks))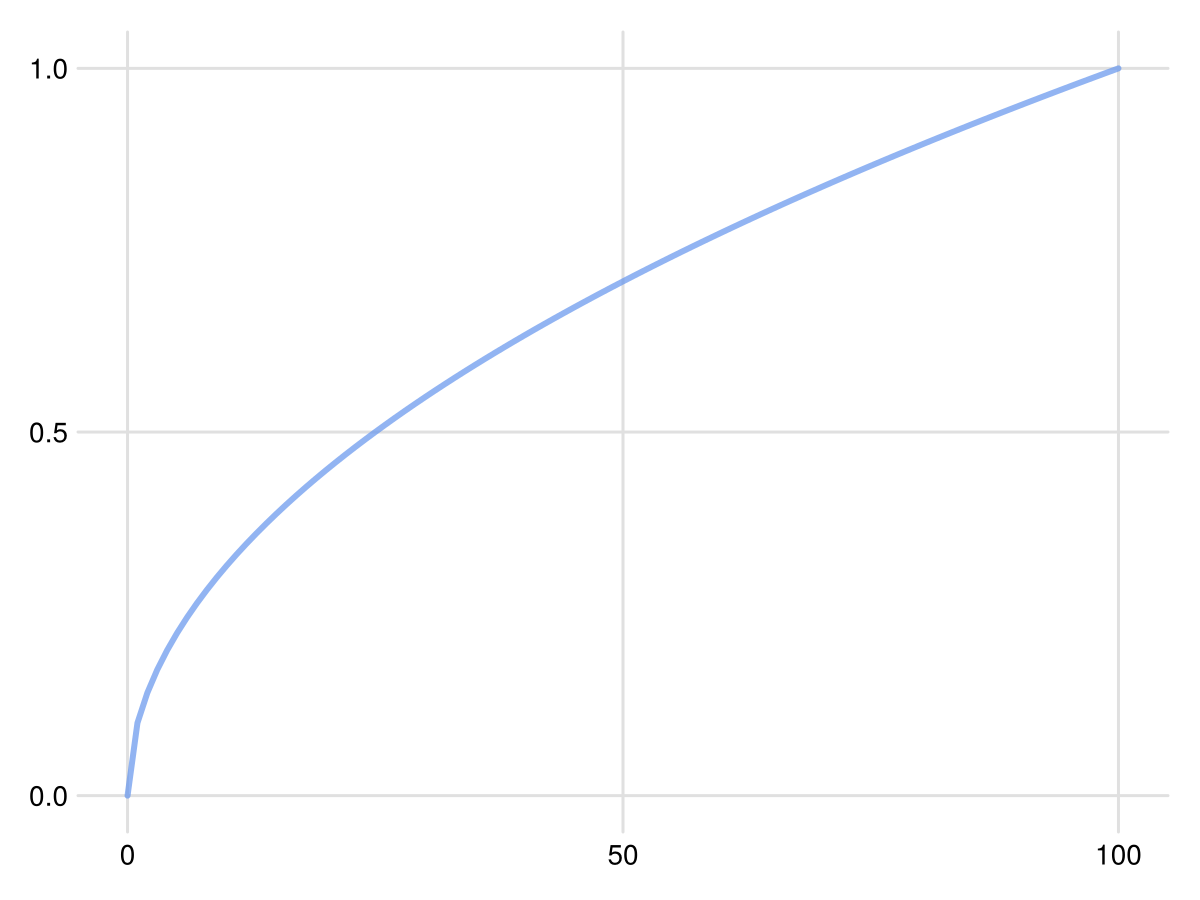
Foresight.percentageticks Function
percentageticks(x)Return an array of strings representing the values in x as percentages, rounded to the nearest integer.
reverse legend
Reverses the order of legend entries
Foresight.reverselegend! Function
reverselegend!(l::Legend)Reverse the order of the legend entries in an Axis object. This is useful when you want to change the order of the legend entries without changing the order of the plotted data.
sourcebrighten and darken
Brighten a color by a given factor by blending it with white:
c = cornflowerblue
b = brighten(c, 0.2) # Brightens the color by 20%
Or, darken a color by blending it with black:
c = cornflowerblue
d = darken(c, 0.2) # Darkens the color by 20%
widen
Slightly widens an interval by a fraction δ.
x = 0..1
Foresight.widen(x, 0.1)
-0.1 .. 1.1freeze!
Freezes the axis limits of a Makie figure.
fig, ax, plt = scatter(rand(10), rand(10))
freeze!(ax)
clip
Copies a Makie figure to the clipboard.
fig, ax, plt = scatter(rand(10), rand(10))
clip(fig)
Foresight.clip Function
tmpfile = clip(fig=Makie.current_figure(), fmt=:png; kwargs...)Save the current figure to a temporary file and copy it to the clipboard. kwargs are passed to Makie.save.
Example
f = plot(-5:0.01:5, x->sinc(x))
clip(f)importall
Imports all symbols from a module into the current scope. Use with caution.
importall(Foresight) .|> evalForesight.importall Function
importall(module)Return an array of expressions that can be used to import all names from a module.
Example
importall(module) .|> eval