Recipes
Trajectory
TimeseriesMakie.trajectory Function
trajectory(x, y, [z]; kwargs...)Plots a colored trajectory in 2D or 3D space.
Key attribtues:
color = :speed: The coloring method for the trajectory.
Can be one of:
:speed: Color by speed along the trajectory:time: Color by time index<: AbstractVector: Color by a custom vector of valuesUnion{<:Symbol, <:Colorant}: Color by a fixed color
Other attributes are shared with Makie.Lines.
Plot type
The plot type alias for the trajectory function is Trajectory.
f = Figure(size = (600, 600))

ϕ = 0:0.1:(8π) |> reverse
x = ϕ .* exp.(ϕ .* im)
y = imag.(x)
x = real.(x)

# * Default
ax = Axis(f[1, 1], title = "Default")
trajectory!(ax, x, y)

# * Speed
ax = Axis(f[1, 2], title = "Speed")
trajectory!(ax, x, y; color = :speed)

# * Alpha
ax = Axis(f[2, 1], title = "Time")
trajectory!(ax, x, y; color = :time)

# * 3D
ax = Axis3(f[2, 2], title = "3D")
trajectory!(ax, x, y, x .* y; color = :speed)

f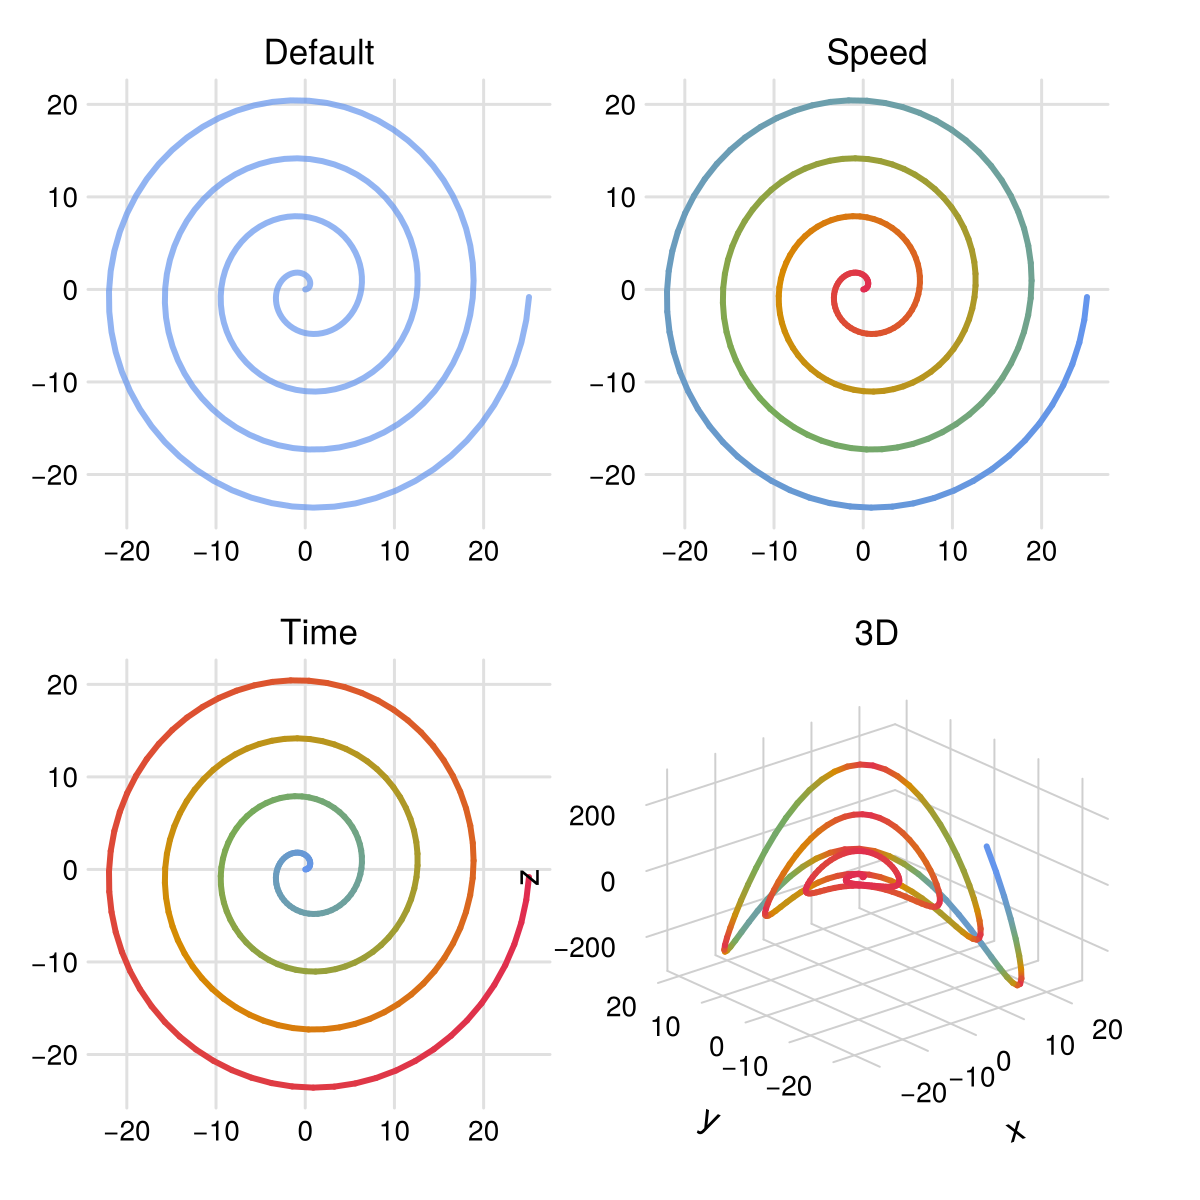
Shadows
TimeseriesMakie.shadows Function
shadows(x, y, z; kwargs...)Plots shadows of a 3D trajectory onto the enclosing axis panes.
Key attributes:
mode = :projection: The shadowing mode
swapshadows = automatic: Whether to swap the axes for each shadow.
Can be:
trueorfalse: Swap the axes for all shadows from their default valuesNTuple{3, Bool}: Swap the default axes for each shadow individually (x, y, z)automatic: Defaults to(true, true, false)
limits = automatic: The targeted axis limits. To ensure the shadows align with the axes, it is best to provide the Axis limits here. If automatic, the limits are inferred from the data.
Other attributes are shared with Makie.Lines.
Plot type
The plot type alias for the shadows function is Shadows.
 f = Figure(size = (500, 500))

ϕ = 0:0.1:(8π) |> reverse
x = ϕ .* exp.(ϕ .* im)
y = imag.(x)
x = real.(x)
z = x .* y

limits = (extrema(x), extrema(y), extrema(z))
ax = Axis3(f[1, 1]; title = "Shadows", limits)
lines!(ax, x, y, z)
shadows!(ax, x, y, z; limits, linewidth = 0.5)

f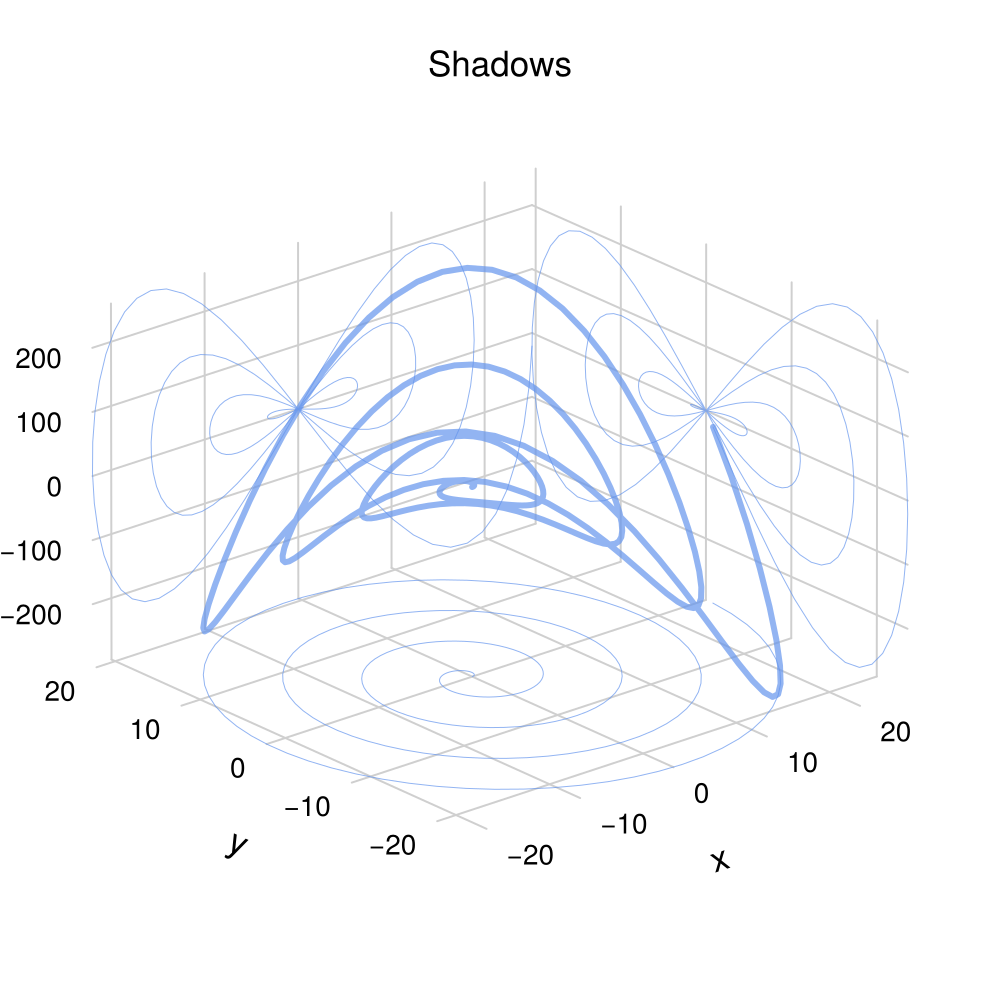
Traces
TimeseriesMakie.traces Function
traces(x, y, Z; kwargs...)Plot the columns of Z over the domain x, colored by y.
Key attributes:
linecolor=automatic: Sets the color of the traces.spacing=0: The spacing between traces.
Can be a number in data space, or one of the following modes: - :even: Even spacing equal to the greatest difference between traces. - :close: Successive traces are spaced by the smallest difference between them.
offset=1: The offset factor (offset * spacing)
Other attributes are shared with Makie.Lines.
Plot type
The plot type alias for the traces function is Traces.
f = Figure(size = (900, 300))

x = 0:0.1:10
y = range(0, π, length = 5)
Z = [sin.(x .+ i) for i in y]
Z = stack(Z)

ax = Axis(f[1, 1]; title = "Unstacked")
p = traces!(ax, x, y, Z)
Colorbar(f[1, 2], p)

ax = Axis(f[1, 3]; title = "Even")
p = traces!(ax, x, y, Z; spacing = :even, offset = 1.5)
Colorbar(f[1, 4], p)

ax = Axis(f[1, 5]; title = "Close")
p = traces!(ax, x, y, Z; spacing = :close, offset = 1.5)
Colorbar(f[1, 6], p)

f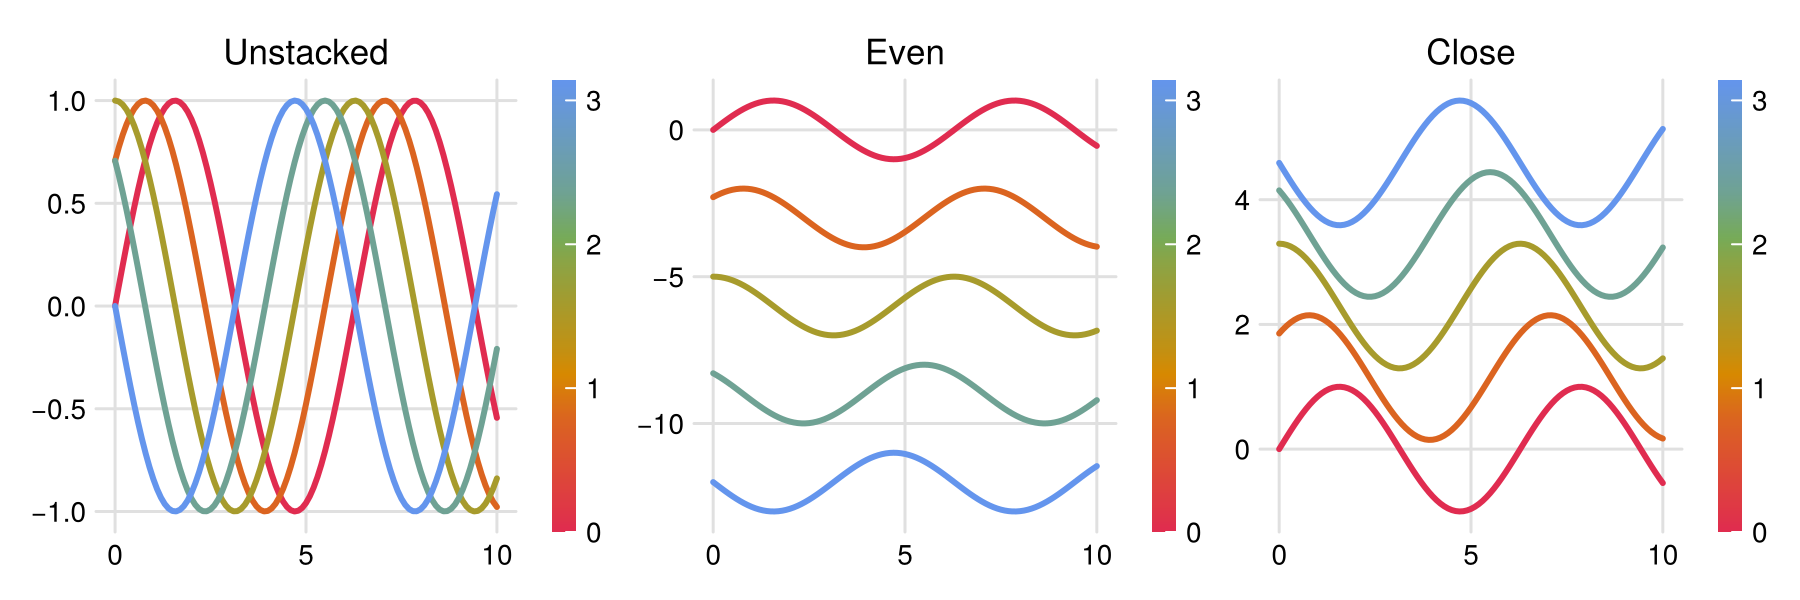
Trail
TimeseriesMakie.trail Function
trail(x, y; kwargs...)Plot a fading trace of points in 2D or 3D space.
Key attributes:
npoints = automatic: Fixes the length of the trail. By default, this is equal to the length of x and y. If npoints is less than the length of x and y, the last npoints will be plotted.
linecolor = @inherit linecolor: Sets the color of the trail. Should be a single color (e.g. "red", :red, (:red, 0.2), RGBA(0.1, 0.2, 0.3, 0.4)). This value is overridden by color
color = nothing: Specifies the color values for the trail.
If !isnothing(color), trail colors will be sampled from the colormap depending on the value of color. color can be:
A collection of numbers representing values to be sampled from the colormap.
A function of the index of a point in the trail (e.g.
Base.Fix2(^, 3)).
colormap = @inherit colormap: Specifies the colormap to use for the trail when !isnothing(color).
alpha = identity: Controls the transparency profile of the trail. alpha can be:
A single number (e.g.
0.5).A function of the index of a point in the trail (e.g.
Base.Fix2(^, 3)).A collection of numbers representing alpha values for each point in the trail.
To sidestep alpha normalization, explicitly pass a vector of alpha values.
Other attributes are shared with Makie.Lines.
Plot type
The plot type alias for the trail function is Trail.
f = Figure(size = (600, 600))

ϕ = 0:0.1:(8π) |> reverse
x = ϕ .* exp.(ϕ .* im)
y = imag.(x)
x = real.(x)

# * Default
ax = Axis(f[1, 1], title = "Default")
trail!(ax, x, y)

# * Colormap
ax = Axis(f[1, 2], title = "Colormap")
trail!(ax, x, y; color = 1:500)

# * Alpha
ax = Axis(f[2, 1], title = "Alpha^3")
trail!(ax, x, y; alpha = Base.Fix2(^, 3))

# * Shorter trail
ax = Axis(f[2, 2], title = "Shorter trail")
trail!(ax, x, y; n_points = 100)

linkaxes!(contents(f.layout))
hidedecorations!.(contents(f.layout))
f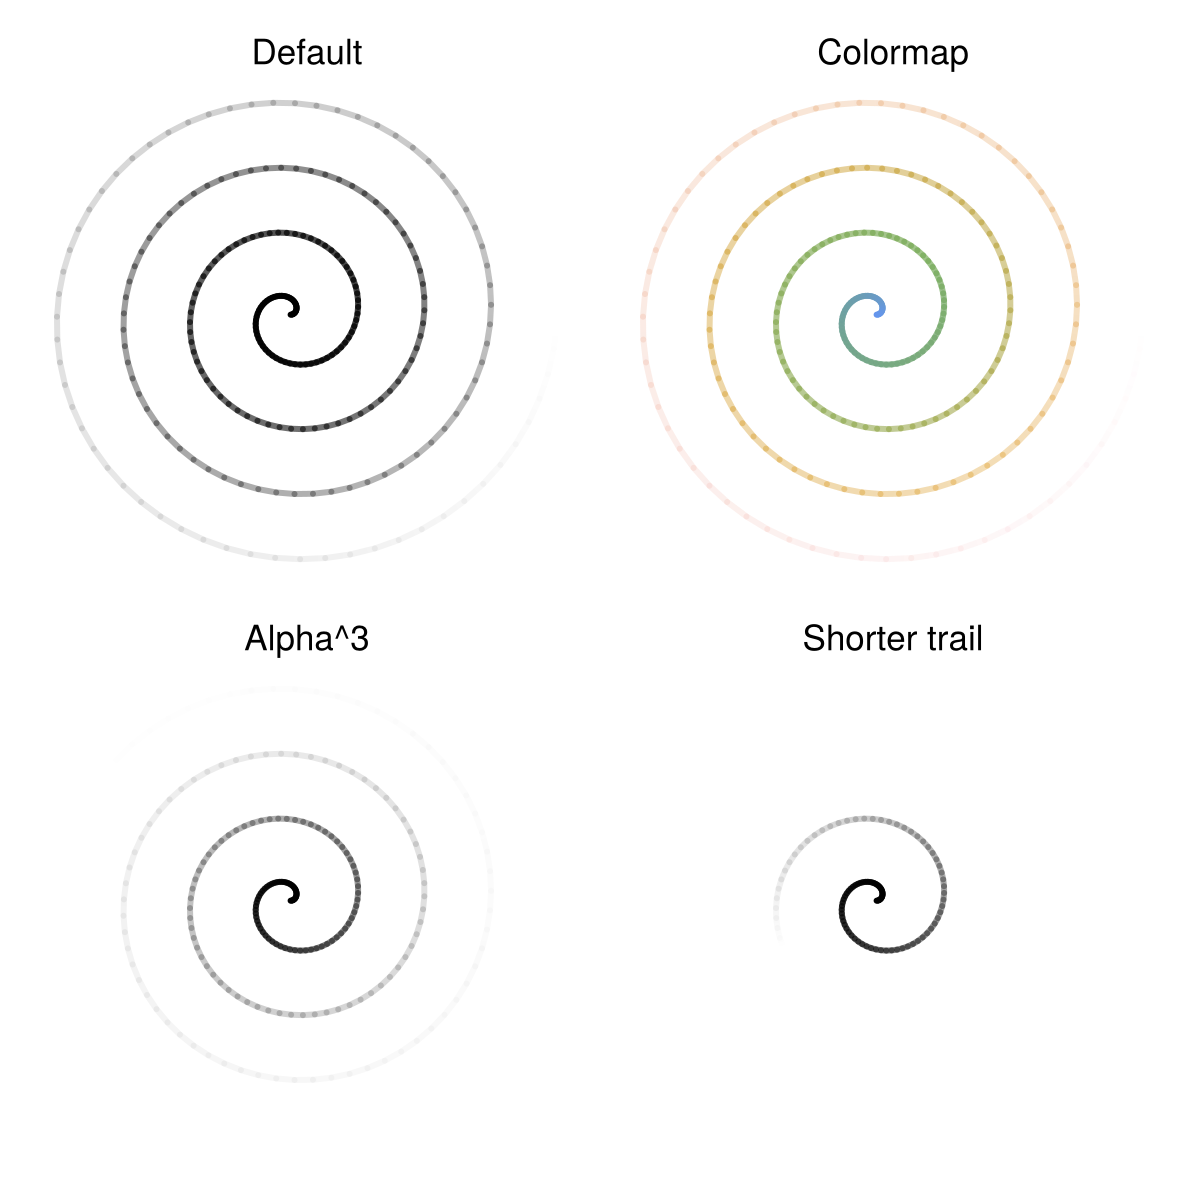
You can animate a trail with:
f = Figure(size = (300, 300))
r = 50 # Set the limits so the axis doesn't resize during the animation
ax = Axis(f[1, 1], limits = ((-r, r), (-r, r)))
xy = Observable([Point2f(first.([x, y]))])
p = trail!(ax, xy, n_points = 100)
hidedecorations!(ax)

record(f, "trail_animation.mp4", zip(x, y)) do _xy
    xy[] = push!(xy[], Point2f(_xy))
end
Kinetic
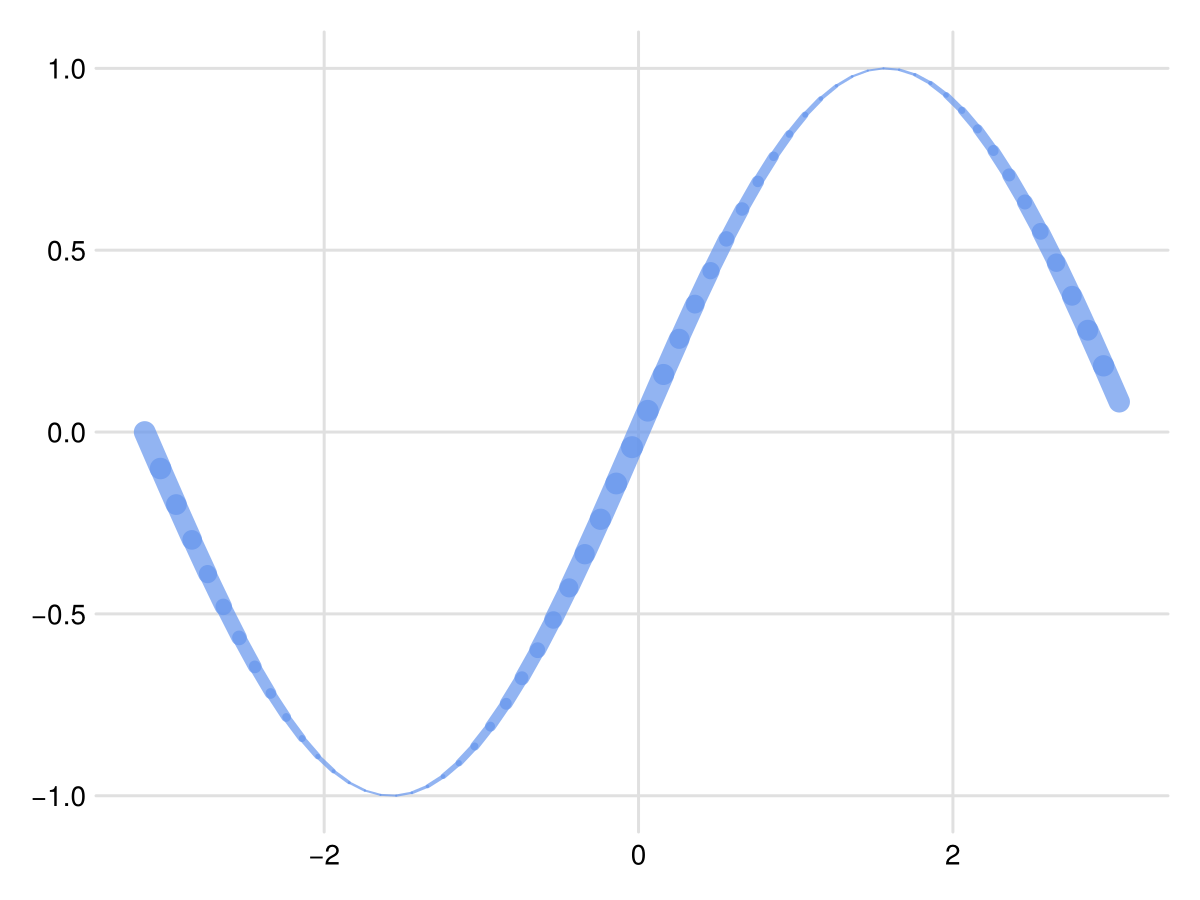
TimeseriesMakie.kinetic Function
kinetic(x, y; kwargs...)Plots a line with a varying width.
Key attribtues:
linewidth = :curv:
Sets the algorithm for determining the line width.
:curv- Width is determined by the velocity:x- Width is determined by the x-coordinate:y- Width is determined by the y-coordinate<: Number- Width is set to a constant value
linewidthscale = 1: Scale factor for the line width.
Other attributes are shared with Makie.Lines.
Plot type
The plot type alias for the kinetic function is Kinetic.
x = -π:0.1:π
kinetic(x, sin.(x))