TimeseriesMakie.Kinetic Type
Kinetic is the plot type associated with plotting function kinetic. Check the docstring for kinetic for further information.
TimeseriesMakie.PSTH Type
PSTH is the plot type associated with plotting function psth. Check the docstring for psth for further information.
TimeseriesMakie.RateMap Type
RateMap is the plot type associated with plotting function ratemap. Check the docstring for ratemap for further information.
TimeseriesMakie.Shadows Type
Shadows is the plot type associated with plotting function shadows. Check the docstring for shadows for further information.
TimeseriesMakie.SpikeRaster Type
SpikeRaster is the plot type associated with plotting function spikeraster. Check the docstring for spikeraster for further information.
TimeseriesMakie.Traces Type
Traces is the plot type associated with plotting function traces. Check the docstring for traces for further information.
TimeseriesMakie.Trail Type
Trail is the plot type associated with plotting function trail. Check the docstring for trail for further information.
TimeseriesMakie.Trajectory Type
Trajectory is the plot type associated with plotting function trajectory. Check the docstring for trajectory for further information.
TimeseriesMakie.kinetic Function
kinetic(x, y; kwargs...)Plots a line with a varying width.
Key attribtues:
linewidth = :curv:
Sets the algorithm for determining the line width.
:curv- Width is determined by the velocity:x- Width is determined by the x-coordinate:y- Width is determined by the y-coordinate<: Number- Width is set to a constant value
linewidthscale = 1: Scale factor for the line width.
Other attributes are shared with Makie.Lines.
Plot type
The plot type alias for the kinetic function is Kinetic.
Attributes
alpha = 1.0 — The alpha value of the colormap or color attribute. Multiple alphas like in plot(alpha=0.2, color=(:red, 0.5)), will get multiplied.
clip_planes = @inherit clip_planes automatic — Clip planes offer a way to do clipping in 3D space. You can set a Vector of up to 8 Plane3f planes here, behind which plots will be clipped (i.e. become invisible). By default clip planes are inherited from the parent plot or scene. You can remove parent clip_planes by passing Plane3f[].
color = @inherit linecolor — No docs available.
colormap = @inherit colormap :viridis — Sets the colormap that is sampled for numeric colors. PlotUtils.cgrad(...), Makie.Reverse(any_colormap) can be used as well, or any symbol from ColorBrewer or PlotUtils. To see all available color gradients, you can call Makie.available_gradients().
colorrange = automatic — The values representing the start and end points of colormap.
colorscale = identity — The color transform function. Can be any function, but only works well together with Colorbar for identity, log, log2, log10, sqrt, logit, Makie.pseudolog10, Makie.Symlog10, Makie.AsinhScale, Makie.SinhScale, Makie.LogScale, Makie.LuptonAsinhScale, and Makie.PowerScale.
cycle = :color — No docs available.
depth_shift = 0.0 — Adjusts the depth value of a plot after all other transformations, i.e. in clip space, where -1 <= depth <= 1. This only applies to GLMakie and WGLMakie and can be used to adjust render order (like a tunable overdraw).
fxaa = false — Adjusts whether the plot is rendered with fxaa (fast approximate anti-aliasing, GLMakie only). Note that some plots implement a better native anti-aliasing solution (scatter, text, lines). For them fxaa = true generally lowers quality. Plots that show smoothly interpolated data (e.g. image, surface) may also degrade in quality as fxaa = true can cause blurring.
highclip = automatic — The color for any value above the colorrange.
inspectable = @inherit inspectable — Sets whether this plot should be seen by DataInspector. The default depends on the theme of the parent scene.
inspector_clear = automatic — Sets a callback function (inspector, plot) -> ... for cleaning up custom indicators in DataInspector.
inspector_hover = automatic — Sets a callback function (inspector, plot, index) -> ... which replaces the default show_data methods.
inspector_label = automatic — Sets a callback function (plot, index, position) -> string which replaces the default label generated by DataInspector.
joinstyle = @inherit joinstyle — Controls the rendering at corners. Options are :miter for sharp corners, :bevel for "cut off" corners, and :round for rounded corners. If the corner angle is below miter_limit, :miter is equivalent to :bevel to avoid long spikes.
linecap = :round — No docs available.
linestyle = nothing — Sets the dash pattern of the line. Options are :solid (equivalent to nothing), :dot, :dash, :dashdot and :dashdotdot. These can also be given in a tuple with a gap style modifier, either :normal, :dense or :loose. For example, (:dot, :loose) or (:dashdot, :dense).
For custom patterns have a look at Makie.Linestyle.
linewidth = :curv — No docs available.
linewidthscale = 1 — No docs available.
lowclip = automatic — The color for any value below the colorrange.
miter_limit = @inherit miter_limit — Sets the minimum inner join angle below which miter joins truncate. See also Makie.miter_distance_to_angle.
model = automatic — Sets a model matrix for the plot. This overrides adjustments made with translate!, rotate! and scale!.
nan_color = :transparent — The color for NaN values.
overdraw = false — Controls if the plot will draw over other plots. This specifically means ignoring depth checks in GL backends
space = :data — Sets the transformation space for box encompassing the plot. See Makie.spaces() for possible inputs.
ssao = false — Adjusts whether the plot is rendered with ssao (screen space ambient occlusion). Note that this only makes sense in 3D plots and is only applicable with fxaa = true.
transformation = :automatic — Controls the inheritance or directly sets the transformations of a plot. Transformations include the transform function and model matrix as generated by translate!(...), scale!(...) and rotate!(...). They can be set directly by passing a Transformation() object or inherited from the parent plot or scene. Inheritance options include:
:automatic: Inherit transformations if the parent and childspaceis compatible:inherit: Inherit transformations:inherit_model: Inherit only model transformations:inherit_transform_func: Inherit only the transform function:nothing: Inherit neither, fully disconnecting the child's transformations from the parent
Another option is to pass arguments to the transform!() function which then get applied to the plot. For example transformation = (:xz, 1.0) which rotates the xy plane to the xz plane and translates by 1.0. For this inheritance defaults to :automatic but can also be set through e.g. (:nothing, (:xz, 1.0)).
transparency = false — Adjusts how the plot deals with transparency. In GLMakie transparency = true results in using Order Independent Transparency.
visible = true — Controls whether the plot gets rendered or not.
TimeseriesMakie.kinetic! Function
kinetic! is the mutating variant of plotting function kinetic. Check the docstring for kinetic for further information.
TimeseriesMakie.psth Function
psth(times; kwargs...)Peri-stimulus time histogram: bin spike times into a histogram of population activity over time.
Key attributes:
binwidth=automatic: bin width in time units (automaticuses the time range / 50).normalization=:rate::count(spikes per bin) or:rate(spikes per unit time). Withnneuronsset, the rate is additionally divided by the neuron count (a per-neuron rate).nneurons=automatic: divide the rate by this many neurons (per-neuron normalisation).
Other attributes are shared with Makie.BarPlot.
Plot type
The plot type alias for the psth function is PSTH.
Attributes
alpha = 1.0 — The alpha value of the colormap or color attribute. Multiple alphas like in plot(alpha=0.2, color=(:red, 0.5)), will get multiplied.
bar_labels = nothing — Labels added at the end of each bar.
binwidth = automatic — Bin width in time units (automatic = time range / 50).
clip_planes = @inherit clip_planes automatic — Clip planes offer a way to do clipping in 3D space. You can set a Vector of up to 8 Plane3f planes here, behind which plots will be clipped (i.e. become invisible). By default clip planes are inherited from the parent plot or scene. You can remove parent clip_planes by passing Plane3f[].
color = @inherit patchcolor — Sets the color of bars.
color_over_background = automatic — Sets the color of labels that are drawn outside of bars. Defaults to label_color
color_over_bar = automatic — Sets the color of labels that are drawn inside of/over bars. Defaults to label_color
colormap = @inherit colormap :viridis — Sets the colormap that is sampled for numeric colors. PlotUtils.cgrad(...), Makie.Reverse(any_colormap) can be used as well, or any symbol from ColorBrewer or PlotUtils. To see all available color gradients, you can call Makie.available_gradients().
colorrange = automatic — The values representing the start and end points of colormap.
colorscale = identity — The color transform function. Can be any function, but only works well together with Colorbar for identity, log, log2, log10, sqrt, logit, Makie.pseudolog10, Makie.Symlog10, Makie.AsinhScale, Makie.SinhScale, Makie.LogScale, Makie.LuptonAsinhScale, and Makie.PowerScale.
cycle = [:color => :patchcolor] — Sets which attributes to cycle when creating multiple plots. The values to cycle through are defined by the parent Theme. Multiple cycled attributes can be set by passing a vector. Elements can
directly refer to a cycled attribute, e.g.
:colormap a cycled attribute to a palette attribute, e.g.
:linecolor => :colormap multiple cycled attributes to a palette attribute, e.g.
[:linecolor, :markercolor] => :color
depth_shift = 0.0 — Adjusts the depth value of a plot after all other transformations, i.e. in clip space, where -1 <= depth <= 1. This only applies to GLMakie and WGLMakie and can be used to adjust render order (like a tunable overdraw).
direction = :y — Controls the direction of the bars. can be :y (height is vertical) or :x (height is horizontal).
dodge = automatic — Dodge can be used to separate bars drawn at the same position. For this each bar is given an integer value corresponding to its position relative to the given positions. E.g. with positions = [1, 1, 1, 2, 2, 2] we have 3 bars at each position which can be separated by dodge = [1, 2, 3, 1, 2, 3].
dodge_gap = 0.03 — Sets the gap between dodged bars relative to the size of the dodged bars.
fillto = automatic — Controls the baseline of the bars. This is zero in the default automatic case unless the barplot is in a log-scaled Axis. With a log scale, the automatic default is half the minimum value because zero is an invalid value for a log scale.
flip_labels_at = Inf — Sets a height value beyond which labels are drawn inside the bar instead of outside.
fxaa = true — Adjusts whether the plot is rendered with fxaa (fast approximate anti-aliasing, GLMakie only). Note that some plots implement a better native anti-aliasing solution (scatter, text, lines). For them fxaa = true generally lowers quality. Plots that show smoothly interpolated data (e.g. image, surface) may also degrade in quality as fxaa = true can cause blurring.
gap = 0 — Fraction of each bin left empty between bars.
highclip = automatic — The color for any value above the colorrange.
inspectable = @inherit inspectable — Sets whether this plot should be seen by DataInspector. The default depends on the theme of the parent scene.
inspector_clear = automatic — Sets a callback function (inspector, plot) -> ... for cleaning up custom indicators in DataInspector.
inspector_hover = automatic — Sets a callback function (inspector, plot, index) -> ... which replaces the default show_data methods.
inspector_label = automatic — Sets a callback function (plot, index, position) -> string which replaces the default label generated by DataInspector.
label_align = automatic — Sets the text alignment of labels.
label_color = @inherit textcolor — Sets the color of labels.
label_font = @inherit font — The font of the bar labels.
label_formatter = bar_label_formatter — Formatting function which is applied to bar labels before they are passed on text()
label_offset = 5 — The distance of the labels from the bar ends in screen units. Does not apply when label_position = :center.
label_position = :end — The position of each bar's label relative to the bar. Possible values are :end or :center.
label_rotation = 0π — Sets the text rotation of labels in radians.
label_size = @inherit fontsize — The font size of the bar labels.
lowclip = automatic — The color for any value below the colorrange.
model = automatic — Sets a model matrix for the plot. This overrides adjustments made with translate!, rotate! and scale!.
n_dodge = automatic — Sets the maximum integer for dodge. This sets how many bars can be placed at a given position, controlling their width.
nan_color = :transparent — The color for NaN values.
nneurons = automatic — Divide the rate by this many neurons (automatic = no per-neuron scaling).
normalization = :rate — :count (spikes per bin) or :rate (spikes per unit time).
offset = 0.0 — Offsets all bars by the given real value. Can also be set per-bar.
overdraw = false — Controls if the plot will draw over other plots. This specifically means ignoring depth checks in GL backends
space = :data — Sets the transformation space for box encompassing the plot. See Makie.spaces() for possible inputs.
ssao = false — Adjusts whether the plot is rendered with ssao (screen space ambient occlusion). Note that this only makes sense in 3D plots and is only applicable with fxaa = true.
stack = automatic — Similar to dodge, this allows bars at the same positions to be stacked by identifying their stack position with integers. E.g. with positions = [1, 1, 1, 2, 2, 2] each group of 3 bars can be stacked with stack = [1, 2, 3, 1, 2, 3].
strokecolor = @inherit patchstrokecolor — Sets the outline color of bars.
strokewidth = @inherit patchstrokewidth — Sets the outline linewidth of bars.
transformation = :automatic — Controls the inheritance or directly sets the transformations of a plot. Transformations include the transform function and model matrix as generated by translate!(...), scale!(...) and rotate!(...). They can be set directly by passing a Transformation() object or inherited from the parent plot or scene. Inheritance options include:
:automatic: Inherit transformations if the parent and childspaceis compatible:inherit: Inherit transformations:inherit_model: Inherit only model transformations:inherit_transform_func: Inherit only the transform function:nothing: Inherit neither, fully disconnecting the child's transformations from the parent
Another option is to pass arguments to the transform!() function which then get applied to the plot. For example transformation = (:xz, 1.0) which rotates the xy plane to the xz plane and translates by 1.0. For this inheritance defaults to :automatic but can also be set through e.g. (:nothing, (:xz, 1.0)).
transparency = false — Adjusts how the plot deals with transparency. In GLMakie transparency = true results in using Order Independent Transparency.
visible = true — Controls whether the plot gets rendered or not.
width = automatic — The gapless width of the bars. If automatic, the width w is calculated as minimum(diff(sort(unique(positions))). The actual width of the bars is calculated as w * (1 - gap).
TimeseriesMakie.psth! Function
psth! is the mutating variant of plotting function psth. Check the docstring for psth for further information.
TimeseriesMakie.ratemap Function
ratemap(raster; kwargs...)
ratemap(times, raster; kwargs...)
Per-neuron time-resolved firing rate as a Neuron × Time heatmap. raster is a Neuron × Time matrix: a boolean spike mask or an already-computed rate field. times (optional) supplies the time axis; without it the columns are indexed 1:ntime. Time is coarse-grained into bins of binwidth columns, each cell the mean over its bin.
Key attributes:
binwidth=automatic: number of time columns per bin (automatic= no binning).
Other attributes are shared with Makie.Heatmap.
Plot type
The plot type alias for the ratemap function is RateMap.
Attributes
alpha = 1.0 — The alpha value of the colormap or color attribute. Multiple alphas like in plot(alpha=0.2, color=(:red, 0.5)), will get multiplied.
binwidth = automatic — Number of time columns per bin (automatic = no binning).
clip_planes = @inherit clip_planes automatic — Clip planes offer a way to do clipping in 3D space. You can set a Vector of up to 8 Plane3f planes here, behind which plots will be clipped (i.e. become invisible). By default clip planes are inherited from the parent plot or scene. You can remove parent clip_planes by passing Plane3f[].
colormap = @inherit colormap :viridis — Sets the colormap that is sampled for numeric colors. PlotUtils.cgrad(...), Makie.Reverse(any_colormap) can be used as well, or any symbol from ColorBrewer or PlotUtils. To see all available color gradients, you can call Makie.available_gradients().
colorrange = automatic — The values representing the start and end points of colormap.
colorscale = identity — The color transform function. Can be any function, but only works well together with Colorbar for identity, log, log2, log10, sqrt, logit, Makie.pseudolog10, Makie.Symlog10, Makie.AsinhScale, Makie.SinhScale, Makie.LogScale, Makie.LuptonAsinhScale, and Makie.PowerScale.
depth_shift = 0.0 — Adjusts the depth value of a plot after all other transformations, i.e. in clip space, where -1 <= depth <= 1. This only applies to GLMakie and WGLMakie and can be used to adjust render order (like a tunable overdraw).
fxaa = true — Adjusts whether the plot is rendered with fxaa (fast approximate anti-aliasing, GLMakie only). Note that some plots implement a better native anti-aliasing solution (scatter, text, lines). For them fxaa = true generally lowers quality. Plots that show smoothly interpolated data (e.g. image, surface) may also degrade in quality as fxaa = true can cause blurring.
highclip = automatic — The color for any value above the colorrange.
inspectable = @inherit inspectable — Sets whether this plot should be seen by DataInspector. The default depends on the theme of the parent scene.
inspector_clear = automatic — Sets a callback function (inspector, plot) -> ... for cleaning up custom indicators in DataInspector.
inspector_hover = automatic — Sets a callback function (inspector, plot, index) -> ... which replaces the default show_data methods.
inspector_label = automatic — Sets a callback function (plot, index, position) -> string which replaces the default label generated by DataInspector.
interpolate = false — Sets whether colors should be interpolated
lowclip = automatic — The color for any value below the colorrange.
model = automatic — Sets a model matrix for the plot. This overrides adjustments made with translate!, rotate! and scale!.
nan_color = :transparent — The color for NaN values.
overdraw = false — Controls if the plot will draw over other plots. This specifically means ignoring depth checks in GL backends
space = :data — Sets the transformation space for box encompassing the plot. See Makie.spaces() for possible inputs.
ssao = false — Adjusts whether the plot is rendered with ssao (screen space ambient occlusion). Note that this only makes sense in 3D plots and is only applicable with fxaa = true.
transformation = :automatic — Controls the inheritance or directly sets the transformations of a plot. Transformations include the transform function and model matrix as generated by translate!(...), scale!(...) and rotate!(...). They can be set directly by passing a Transformation() object or inherited from the parent plot or scene. Inheritance options include:
:automatic: Inherit transformations if the parent and childspaceis compatible:inherit: Inherit transformations:inherit_model: Inherit only model transformations:inherit_transform_func: Inherit only the transform function:nothing: Inherit neither, fully disconnecting the child's transformations from the parent
Another option is to pass arguments to the transform!() function which then get applied to the plot. For example transformation = (:xz, 1.0) which rotates the xy plane to the xz plane and translates by 1.0. For this inheritance defaults to :automatic but can also be set through e.g. (:nothing, (:xz, 1.0)).
transparency = false — Adjusts how the plot deals with transparency. In GLMakie transparency = true results in using Order Independent Transparency.
visible = true — Controls whether the plot gets rendered or not.
TimeseriesMakie.ratemap! Function
ratemap! is the mutating variant of plotting function ratemap. Check the docstring for ratemap for further information.
TimeseriesMakie.shadows Function
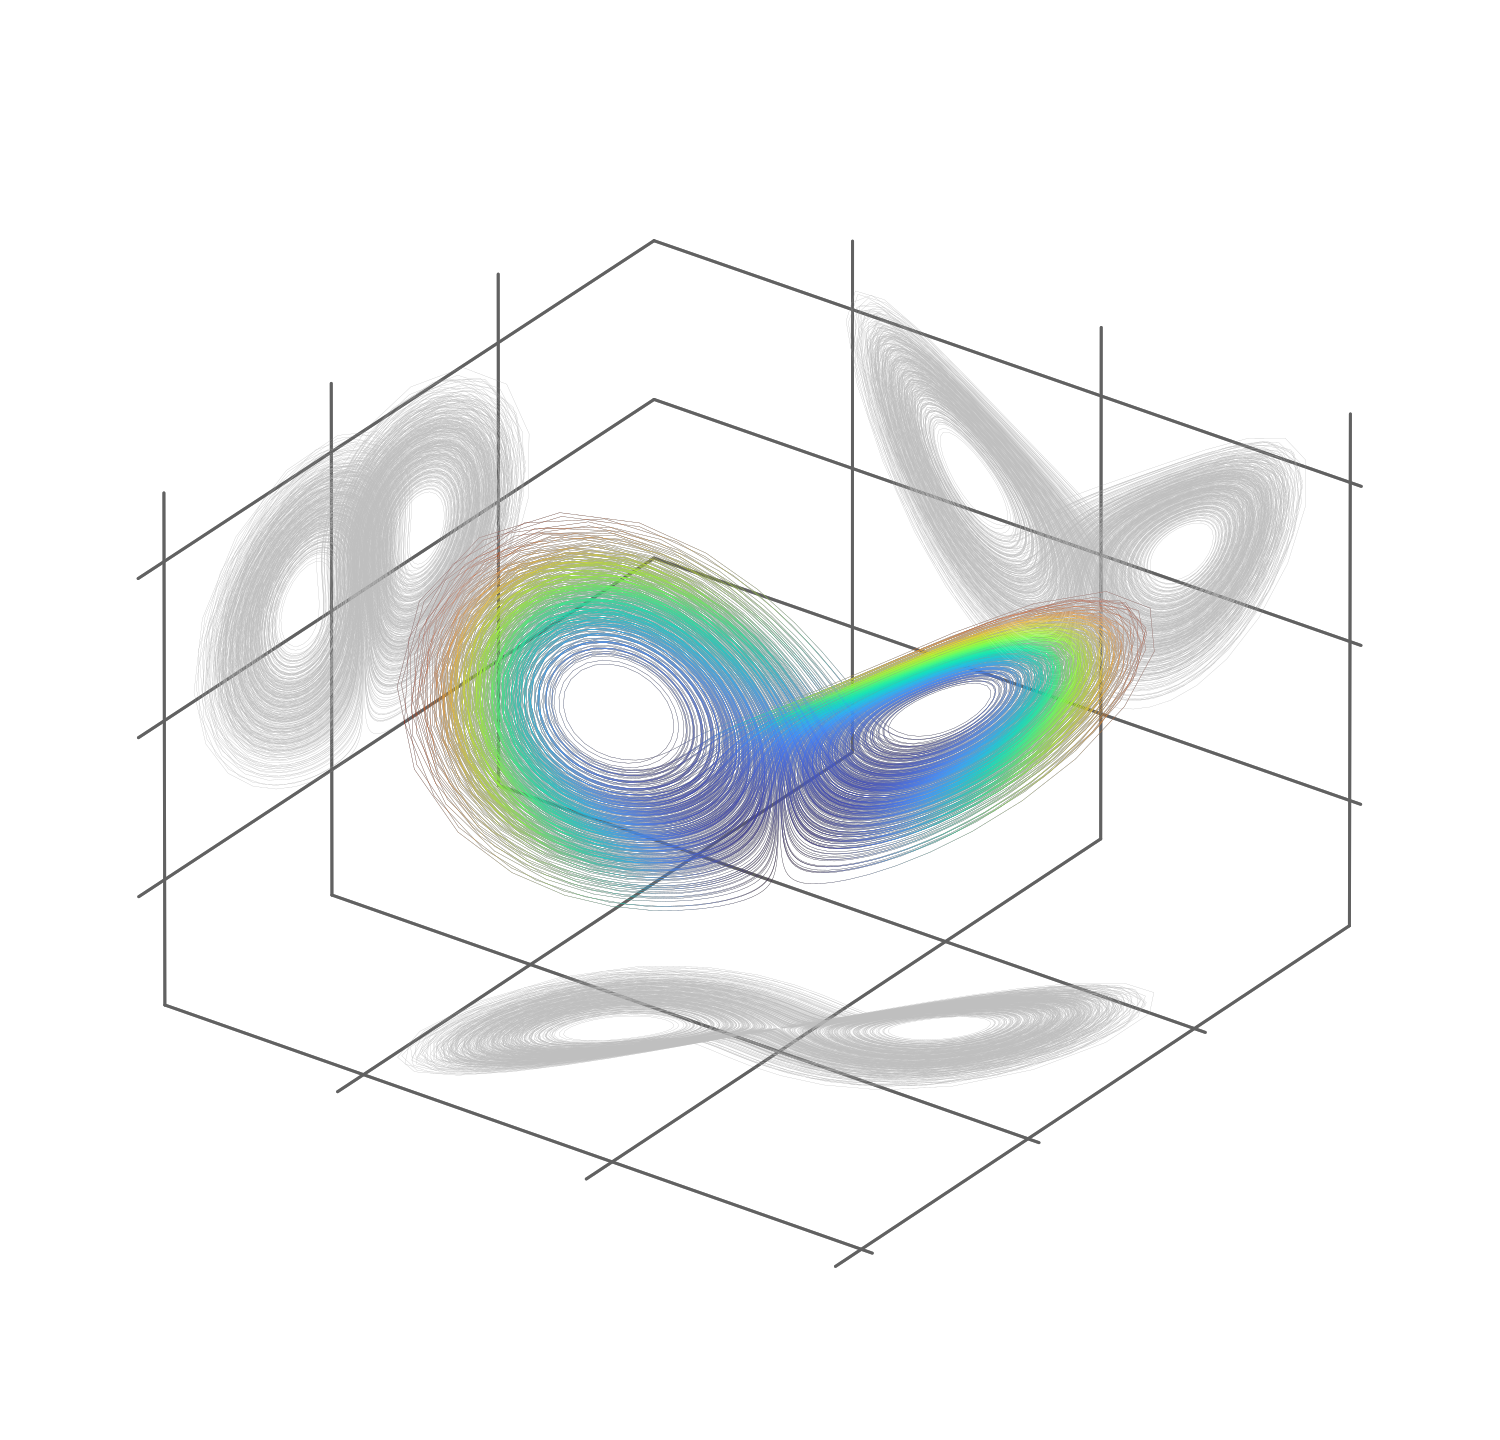
shadows(x, y, z; kwargs...)Plots shadows of a 3D trajectory onto the enclosing axis panes.
Key attributes:
mode = :projection: The shadowing mode
swapshadows = automatic: Whether to swap the axes for each shadow.
Can be:
trueorfalse: Swap the axes for all shadows from their default valuesNTuple{3, Bool}: Swap the default axes for each shadow individually (x, y, z)automatic: Defaults to(true, true, false)
limits = automatic: The targeted axis limits. To ensure the shadows align with the axes, it is best to provide the Axis limits here. If automatic, the limits are inferred from the data.
Other attributes are shared with Makie.Lines.
Plot type
The plot type alias for the shadows function is Shadows.
Attributes
alpha = 1.0 — The alpha value of the colormap or color attribute. Multiple alphas like in plot(alpha=0.2, color=(:red, 0.5)), will get multiplied.
clip_planes = @inherit clip_planes automatic — Clip planes offer a way to do clipping in 3D space. You can set a Vector of up to 8 Plane3f planes here, behind which plots will be clipped (i.e. become invisible). By default clip planes are inherited from the parent plot or scene. You can remove parent clip_planes by passing Plane3f[].
color = @inherit linecolor — The color of the line.
colormap = @inherit colormap :viridis — Sets the colormap that is sampled for numeric colors. PlotUtils.cgrad(...), Makie.Reverse(any_colormap) can be used as well, or any symbol from ColorBrewer or PlotUtils. To see all available color gradients, you can call Makie.available_gradients().
colorrange = automatic — The values representing the start and end points of colormap.
colorscale = identity — The color transform function. Can be any function, but only works well together with Colorbar for identity, log, log2, log10, sqrt, logit, Makie.pseudolog10, Makie.Symlog10, Makie.AsinhScale, Makie.SinhScale, Makie.LogScale, Makie.LuptonAsinhScale, and Makie.PowerScale.
cycle = [:color] — Sets which attributes to cycle when creating multiple plots. The values to cycle through are defined by the parent Theme. Multiple cycled attributes can be set by passing a vector. Elements can
directly refer to a cycled attribute, e.g.
:colormap a cycled attribute to a palette attribute, e.g.
:linecolor => :colormap multiple cycled attributes to a palette attribute, e.g.
[:linecolor, :markercolor] => :color
depth_shift = 0.0 — Adjusts the depth value of a plot after all other transformations, i.e. in clip space, where -1 <= depth <= 1. This only applies to GLMakie and WGLMakie and can be used to adjust render order (like a tunable overdraw).
fxaa = false — Adjusts whether the plot is rendered with fxaa (fast approximate anti-aliasing, GLMakie only). Note that some plots implement a better native anti-aliasing solution (scatter, text, lines). For them fxaa = true generally lowers quality. Plots that show smoothly interpolated data (e.g. image, surface) may also degrade in quality as fxaa = true can cause blurring.
highclip = automatic — The color for any value above the colorrange.
inspectable = @inherit inspectable — Sets whether this plot should be seen by DataInspector. The default depends on the theme of the parent scene.
inspector_clear = automatic — Sets a callback function (inspector, plot) -> ... for cleaning up custom indicators in DataInspector.
inspector_hover = automatic — Sets a callback function (inspector, plot, index) -> ... which replaces the default show_data methods.
inspector_label = automatic — Sets a callback function (plot, index, position) -> string which replaces the default label generated by DataInspector.
joinstyle = @inherit joinstyle — Controls the rendering at corners. Options are :miter for sharp corners, :bevel for "cut off" corners, and :round for rounded corners. If the corner angle is below miter_limit, :miter is equivalent to :bevel to avoid long spikes.
limits = automatic — The targeted axis limits
linecap = @inherit linecap — Sets the type of line cap used. Options are :butt (flat without extrusion), :square (flat with half a linewidth extrusion) or :round.
linestyle = nothing — Sets the dash pattern of the line. Options are :solid (equivalent to nothing), :dot, :dash, :dashdot and :dashdotdot. These can also be given in a tuple with a gap style modifier, either :normal, :dense or :loose. For example, (:dot, :loose) or (:dashdot, :dense).
For custom patterns have a look at Makie.Linestyle.
linewidth = @inherit linewidth — Sets the width of the line in screen units
lowclip = automatic — The color for any value below the colorrange.
miter_limit = @inherit miter_limit — Sets the minimum inner join angle below which miter joins truncate. See also Makie.miter_distance_to_angle.
mode = :projection — The shadowing mode
model = automatic — Sets a model matrix for the plot. This overrides adjustments made with translate!, rotate! and scale!.
nan_color = :transparent — The color for NaN values.
overdraw = false — Controls if the plot will draw over other plots. This specifically means ignoring depth checks in GL backends
space = :data — Sets the transformation space for box encompassing the plot. See Makie.spaces() for possible inputs.
ssao = false — Adjusts whether the plot is rendered with ssao (screen space ambient occlusion). Note that this only makes sense in 3D plots and is only applicable with fxaa = true.
swapshadows = automatic — Whether to swap the axes for each shadow
transformation = :automatic — Controls the inheritance or directly sets the transformations of a plot. Transformations include the transform function and model matrix as generated by translate!(...), scale!(...) and rotate!(...). They can be set directly by passing a Transformation() object or inherited from the parent plot or scene. Inheritance options include:
:automatic: Inherit transformations if the parent and childspaceis compatible:inherit: Inherit transformations:inherit_model: Inherit only model transformations:inherit_transform_func: Inherit only the transform function:nothing: Inherit neither, fully disconnecting the child's transformations from the parent
Another option is to pass arguments to the transform!() function which then get applied to the plot. For example transformation = (:xz, 1.0) which rotates the xy plane to the xz plane and translates by 1.0. For this inheritance defaults to :automatic but can also be set through e.g. (:nothing, (:xz, 1.0)).
transparency = false — Adjusts how the plot deals with transparency. In GLMakie transparency = true results in using Order Independent Transparency.
visible = true — Controls whether the plot gets rendered or not.
TimeseriesMakie.shadows! Function
shadows! is the mutating variant of plotting function shadows. Check the docstring for shadows for further information.
TimeseriesMakie.spikeraster Function
spikeraster(times, ids; kwargs...)Scatter a spike raster: one marker per spike at (time, neuron), where times[k] and ids[k] are the time and (integer) neuron index of the k-th spike.
Alternative single-argument inputs are accepted via convert_arguments:
a vector of per-neuron spike-time vectors (
spikes[n]= the spike times of neuronn);a
Neuron × Timeboolean matrix (a spike mask; columns index time).
Key attributes:
sortby=false: reorder neurons on the y-axis.falsekeeps the id order;:ratesorts by spike count; aFunctionmaps each neuron's spike-time vector to a sort key; a vector supplies an explicit per-neuron key.rev=false: reverse the sort order.
Other attributes are shared with Makie.Scatter.
Plot type
The plot type alias for the spikeraster function is SpikeRaster.
Attributes
alpha = 1.0 — The alpha value of the colormap or color attribute. Multiple alphas like in plot(alpha=0.2, color=(:red, 0.5)), will get multiplied.
clip_planes = @inherit clip_planes automatic — Clip planes offer a way to do clipping in 3D space. You can set a Vector of up to 8 Plane3f planes here, behind which plots will be clipped (i.e. become invisible). By default clip planes are inherited from the parent plot or scene. You can remove parent clip_planes by passing Plane3f[].
color = @inherit markercolor — Sets the color of the marker. If no color is set, multiple calls to scatter! will cycle through the axis color palette.
colormap = @inherit colormap :viridis — Sets the colormap that is sampled for numeric colors. PlotUtils.cgrad(...), Makie.Reverse(any_colormap) can be used as well, or any symbol from ColorBrewer or PlotUtils. To see all available color gradients, you can call Makie.available_gradients().
colorrange = automatic — The values representing the start and end points of colormap.
colorscale = identity — The color transform function. Can be any function, but only works well together with Colorbar for identity, log, log2, log10, sqrt, logit, Makie.pseudolog10, Makie.Symlog10, Makie.AsinhScale, Makie.SinhScale, Makie.LogScale, Makie.LuptonAsinhScale, and Makie.PowerScale.
cycle = [:color] — Sets which attributes to cycle when creating multiple plots. The values to cycle through are defined by the parent Theme. Multiple cycled attributes can be set by passing a vector. Elements can
directly refer to a cycled attribute, e.g.
:colormap a cycled attribute to a palette attribute, e.g.
:linecolor => :colormap multiple cycled attributes to a palette attribute, e.g.
[:linecolor, :markercolor] => :color
depth_shift = 0.0 — Adjusts the depth value of a plot after all other transformations, i.e. in clip space, where -1 <= depth <= 1. This only applies to GLMakie and WGLMakie and can be used to adjust render order (like a tunable overdraw).
depthsorting = false — Enables depth-sorting of markers which can improve border artifacts. Currently supported in GLMakie only.
distancefield = nothing — Optional distancefield used for e.g. font and bezier path rendering. Will get set automatically.
font = "default" — Sets the font to be used for character markers
fxaa = false — Adjusts whether the plot is rendered with fxaa (fast approximate anti-aliasing, GLMakie only). Note that some plots implement a better native anti-aliasing solution (scatter, text, lines). For them fxaa = true generally lowers quality. Plots that show smoothly interpolated data (e.g. image, surface) may also degrade in quality as fxaa = true can cause blurring.
glowcolor = (:black, 0.0) — Sets the color of the glow effect around the marker.
glowwidth = 0.0 — Sets the size of a glow effect around the marker.
highclip = automatic — The color for any value above the colorrange.
inspectable = @inherit inspectable — Sets whether this plot should be seen by DataInspector. The default depends on the theme of the parent scene.
inspector_clear = automatic — Sets a callback function (inspector, plot) -> ... for cleaning up custom indicators in DataInspector.
inspector_hover = automatic — Sets a callback function (inspector, plot, index) -> ... which replaces the default show_data methods.
inspector_label = automatic — Sets a callback function (plot, index, position) -> string which replaces the default label generated by DataInspector.
lowclip = automatic — The color for any value below the colorrange.
marker = @inherit marker — Sets the scatter marker.
marker_offset = Vec3f(0) — The offset of the marker from the given position in markerspace units. An offset of 0 corresponds to a centered marker.
markersize = 4 — Marker size (defaults smaller than Scatter for dense rasters).
markerspace = :pixel — Sets the space in which markersize is given. See Makie.spaces() for possible inputs
model = automatic — Sets a model matrix for the plot. This overrides adjustments made with translate!, rotate! and scale!.
nan_color = :transparent — The color for NaN values.
overdraw = false — Controls if the plot will draw over other plots. This specifically means ignoring depth checks in GL backends
rev = false — Reverse the sort order.
rotation = Billboard() — Sets the rotation of the marker. A Billboard rotation is always around the depth axis.
sortby = false — How to order neurons on the y-axis: false (id order), :rate, a function of a neuron's spike-time vector, or a vector of per-neuron sort keys.
space = :data — Sets the transformation space for box encompassing the plot. See Makie.spaces() for possible inputs.
ssao = false — Adjusts whether the plot is rendered with ssao (screen space ambient occlusion). Note that this only makes sense in 3D plots and is only applicable with fxaa = true.
strokecolor = @inherit markerstrokecolor — Sets the color of the outline around a marker.
strokewidth = @inherit markerstrokewidth — Sets the width of the outline around a marker.
transform_marker = false — Controls whether the model matrix (without translation) applies to the marker itself, rather than just the positions. (If this is true, scale! and rotate! will affect the marker.
transformation = :automatic — Controls the inheritance or directly sets the transformations of a plot. Transformations include the transform function and model matrix as generated by translate!(...), scale!(...) and rotate!(...). They can be set directly by passing a Transformation() object or inherited from the parent plot or scene. Inheritance options include:
:automatic: Inherit transformations if the parent and childspaceis compatible:inherit: Inherit transformations:inherit_model: Inherit only model transformations:inherit_transform_func: Inherit only the transform function:nothing: Inherit neither, fully disconnecting the child's transformations from the parent
Another option is to pass arguments to the transform!() function which then get applied to the plot. For example transformation = (:xz, 1.0) which rotates the xy plane to the xz plane and translates by 1.0. For this inheritance defaults to :automatic but can also be set through e.g. (:nothing, (:xz, 1.0)).
transparency = false — Adjusts how the plot deals with transparency. In GLMakie transparency = true results in using Order Independent Transparency.
visible = true — Controls whether the plot gets rendered or not.
TimeseriesMakie.spikeraster! Function
spikeraster! is the mutating variant of plotting function spikeraster. Check the docstring for spikeraster for further information.
TimeseriesMakie.traces Function
traces(x, y, Z; kwargs...)Plot the columns of Z over the domain x, colored by y.
Key attributes:
linecolor=automatic: Sets the color of the traces.spacing=0: The spacing between traces.
Can be a number in data space, or one of the following modes: - :even: Even spacing equal to the greatest difference between traces. - :close: Successive traces are spaced by the smallest difference between them.
offset=1: The offset factor (offset * spacing)
Other attributes are shared with Makie.Lines.
Plot type
The plot type alias for the traces function is Traces.
Attributes
alpha = 1.0 — The alpha value of the colormap or color attribute. Multiple alphas like in plot(alpha=0.2, color=(:red, 0.5)), will get multiplied.
clip_planes = @inherit clip_planes automatic — Clip planes offer a way to do clipping in 3D space. You can set a Vector of up to 8 Plane3f planes here, behind which plots will be clipped (i.e. become invisible). By default clip planes are inherited from the parent plot or scene. You can remove parent clip_planes by passing Plane3f[].
colormap = @inherit colormap :viridis — Sets the colormap that is sampled for numeric colors. PlotUtils.cgrad(...), Makie.Reverse(any_colormap) can be used as well, or any symbol from ColorBrewer or PlotUtils. To see all available color gradients, you can call Makie.available_gradients().
colorrange = automatic — The values representing the start and end points of colormap.
colorscale = identity — The color transform function. Can be any function, but only works well together with Colorbar for identity, log, log2, log10, sqrt, logit, Makie.pseudolog10, Makie.Symlog10, Makie.AsinhScale, Makie.SinhScale, Makie.LogScale, Makie.LuptonAsinhScale, and Makie.PowerScale.
cycle = [:color] — Sets which attributes to cycle when creating multiple plots. The values to cycle through are defined by the parent Theme. Multiple cycled attributes can be set by passing a vector. Elements can
directly refer to a cycled attribute, e.g.
:colormap a cycled attribute to a palette attribute, e.g.
:linecolor => :colormap multiple cycled attributes to a palette attribute, e.g.
[:linecolor, :markercolor] => :color
depth_shift = 0.0 — Adjusts the depth value of a plot after all other transformations, i.e. in clip space, where -1 <= depth <= 1. This only applies to GLMakie and WGLMakie and can be used to adjust render order (like a tunable overdraw).
fxaa = false — Adjusts whether the plot is rendered with fxaa (fast approximate anti-aliasing, GLMakie only). Note that some plots implement a better native anti-aliasing solution (scatter, text, lines). For them fxaa = true generally lowers quality. Plots that show smoothly interpolated data (e.g. image, surface) may also degrade in quality as fxaa = true can cause blurring.
highclip = automatic — The color for any value above the colorrange.
inspectable = @inherit inspectable — Sets whether this plot should be seen by DataInspector. The default depends on the theme of the parent scene.
inspector_clear = automatic — Sets a callback function (inspector, plot) -> ... for cleaning up custom indicators in DataInspector.
inspector_hover = automatic — Sets a callback function (inspector, plot, index) -> ... which replaces the default show_data methods.
inspector_label = automatic — Sets a callback function (plot, index, position) -> string which replaces the default label generated by DataInspector.
joinstyle = @inherit joinstyle — Controls the rendering at corners. Options are :miter for sharp corners, :bevel for "cut off" corners, and :round for rounded corners. If the corner angle is below miter_limit, :miter is equivalent to :bevel to avoid long spikes.
linecap = @inherit linecap — Sets the type of line cap used. Options are :butt (flat without extrusion), :square (flat with half a linewidth extrusion) or :round.
linecolor = automatic — No docs available.
linestyle = nothing — Sets the dash pattern of the line. Options are :solid (equivalent to nothing), :dot, :dash, :dashdot and :dashdotdot. These can also be given in a tuple with a gap style modifier, either :normal, :dense or :loose. For example, (:dot, :loose) or (:dashdot, :dense).
For custom patterns have a look at Makie.Linestyle.
linewidth = @inherit linewidth — Sets the width of the line in screen units
lowclip = automatic — The color for any value below the colorrange.
miter_limit = @inherit miter_limit — Sets the minimum inner join angle below which miter joins truncate. See also Makie.miter_distance_to_angle.
model = automatic — Sets a model matrix for the plot. This overrides adjustments made with translate!, rotate! and scale!.
nan_color = :transparent — The color for NaN values.
offset = 1 — No docs available.
overdraw = false — Controls if the plot will draw over other plots. This specifically means ignoring depth checks in GL backends
space = :data — Sets the transformation space for box encompassing the plot. See Makie.spaces() for possible inputs.
spacing = 0 — No docs available.
ssao = false — Adjusts whether the plot is rendered with ssao (screen space ambient occlusion). Note that this only makes sense in 3D plots and is only applicable with fxaa = true.
transformation = :automatic — Controls the inheritance or directly sets the transformations of a plot. Transformations include the transform function and model matrix as generated by translate!(...), scale!(...) and rotate!(...). They can be set directly by passing a Transformation() object or inherited from the parent plot or scene. Inheritance options include:
:automatic: Inherit transformations if the parent and childspaceis compatible:inherit: Inherit transformations:inherit_model: Inherit only model transformations:inherit_transform_func: Inherit only the transform function:nothing: Inherit neither, fully disconnecting the child's transformations from the parent
Another option is to pass arguments to the transform!() function which then get applied to the plot. For example transformation = (:xz, 1.0) which rotates the xy plane to the xz plane and translates by 1.0. For this inheritance defaults to :automatic but can also be set through e.g. (:nothing, (:xz, 1.0)).
transparency = false — Adjusts how the plot deals with transparency. In GLMakie transparency = true results in using Order Independent Transparency.
visible = true — Controls whether the plot gets rendered or not.
TimeseriesMakie.traces! Function
traces! is the mutating variant of plotting function traces. Check the docstring for traces for further information.
TimeseriesMakie.trail Function
trail(x, y; kwargs...)Plot a fading trace of points in 2D or 3D space.
Key attributes:
npoints = automatic: Fixes the length of the trail. By default, this is equal to the length of x and y. If npoints is less than the length of x and y, the last npoints will be plotted.
linecolor = @inherit linecolor: Sets the color of the trail. Should be a single color (e.g. "red", :red, (:red, 0.2), RGBA(0.1, 0.2, 0.3, 0.4)). This value is overridden by color
color = nothing: Specifies the color values for the trail.
If !isnothing(color), trail colors will be sampled from the colormap depending on the value of color. color can be:
A collection of numbers representing values to be sampled from the colormap.
A function of the index of a point in the trail (e.g.
Base.Fix2(^, 3)).
colormap = @inherit colormap: Specifies the colormap to use for the trail when !isnothing(color).
alpha = identity: Controls the transparency profile of the trail. alpha can be:
A single number (e.g.
0.5).A function of the index of a point in the trail (e.g.
Base.Fix2(^, 3)).A collection of numbers representing alpha values for each point in the trail.
To sidestep alpha normalization, explicitly pass a vector of alpha values.
Other attributes are shared with Makie.Lines.
Plot type
The plot type alias for the trail function is Trail.
Attributes
alpha = identity — No docs available.
clip_planes = @inherit clip_planes automatic — Clip planes offer a way to do clipping in 3D space. You can set a Vector of up to 8 Plane3f planes here, behind which plots will be clipped (i.e. become invisible). By default clip planes are inherited from the parent plot or scene. You can remove parent clip_planes by passing Plane3f[].
color = nothing — No docs available.
colormap = @inherit colormap — No docs available.
colorrange = automatic — The values representing the start and end points of colormap.
colorscale = identity — The color transform function. Can be any function, but only works well together with Colorbar for identity, log, log2, log10, sqrt, logit, Makie.pseudolog10, Makie.Symlog10, Makie.AsinhScale, Makie.SinhScale, Makie.LogScale, Makie.LuptonAsinhScale, and Makie.PowerScale.
depth_shift = 0.0 — Adjusts the depth value of a plot after all other transformations, i.e. in clip space, where -1 <= depth <= 1. This only applies to GLMakie and WGLMakie and can be used to adjust render order (like a tunable overdraw).
fxaa = false — Adjusts whether the plot is rendered with fxaa (fast approximate anti-aliasing, GLMakie only). Note that some plots implement a better native anti-aliasing solution (scatter, text, lines). For them fxaa = true generally lowers quality. Plots that show smoothly interpolated data (e.g. image, surface) may also degrade in quality as fxaa = true can cause blurring.
highclip = automatic — The color for any value above the colorrange.
inspectable = @inherit inspectable — Sets whether this plot should be seen by DataInspector. The default depends on the theme of the parent scene.
inspector_clear = automatic — Sets a callback function (inspector, plot) -> ... for cleaning up custom indicators in DataInspector.
inspector_hover = automatic — Sets a callback function (inspector, plot, index) -> ... which replaces the default show_data methods.
inspector_label = automatic — Sets a callback function (plot, index, position) -> string which replaces the default label generated by DataInspector.
joinstyle = @inherit joinstyle — Controls the rendering at corners. Options are :miter for sharp corners, :bevel for "cut off" corners, and :round for rounded corners. If the corner angle is below miter_limit, :miter is equivalent to :bevel to avoid long spikes.
linecap = @inherit linecap — Sets the type of line cap used. Options are :butt (flat without extrusion), :square (flat with half a linewidth extrusion) or :round.
linecolor = @inherit linecolor — No docs available.
linestyle = nothing — Sets the dash pattern of the line. Options are :solid (equivalent to nothing), :dot, :dash, :dashdot and :dashdotdot. These can also be given in a tuple with a gap style modifier, either :normal, :dense or :loose. For example, (:dot, :loose) or (:dashdot, :dense).
For custom patterns have a look at Makie.Linestyle.
linewidth = @inherit linewidth — Sets the width of the line in screen units
lowclip = automatic — The color for any value below the colorrange.
miter_limit = @inherit miter_limit — Sets the minimum inner join angle below which miter joins truncate. See also Makie.miter_distance_to_angle.
model = automatic — Sets a model matrix for the plot. This overrides adjustments made with translate!, rotate! and scale!.
n_points = automatic — No docs available.
nan_color = :transparent — The color for NaN values.
overdraw = false — Controls if the plot will draw over other plots. This specifically means ignoring depth checks in GL backends
space = :data — Sets the transformation space for box encompassing the plot. See Makie.spaces() for possible inputs.
ssao = false — Adjusts whether the plot is rendered with ssao (screen space ambient occlusion). Note that this only makes sense in 3D plots and is only applicable with fxaa = true.
transformation = :automatic — Controls the inheritance or directly sets the transformations of a plot. Transformations include the transform function and model matrix as generated by translate!(...), scale!(...) and rotate!(...). They can be set directly by passing a Transformation() object or inherited from the parent plot or scene. Inheritance options include:
:automatic: Inherit transformations if the parent and childspaceis compatible:inherit: Inherit transformations:inherit_model: Inherit only model transformations:inherit_transform_func: Inherit only the transform function:nothing: Inherit neither, fully disconnecting the child's transformations from the parent
Another option is to pass arguments to the transform!() function which then get applied to the plot. For example transformation = (:xz, 1.0) which rotates the xy plane to the xz plane and translates by 1.0. For this inheritance defaults to :automatic but can also be set through e.g. (:nothing, (:xz, 1.0)).
transparency = false — Adjusts how the plot deals with transparency. In GLMakie transparency = true results in using Order Independent Transparency.
visible = true — Controls whether the plot gets rendered or not.
TimeseriesMakie.trail! Function
trail! is the mutating variant of plotting function trail. Check the docstring for trail for further information.
TimeseriesMakie.trajectory Function
trajectory(x, y, [z]; kwargs...)Plots a colored trajectory in 2D or 3D space.
Key attribtues:
color = :speed: The coloring method for the trajectory.
Can be one of:
:speed: Color by speed along the trajectory:time: Color by time index<: AbstractVector: Color by a custom vector of valuesUnion{<:Symbol, <:Colorant}: Color by a fixed color
Other attributes are shared with Makie.Lines.
Plot type
The plot type alias for the trajectory function is Trajectory.
Attributes
alpha = 1.0 — The alpha value of the colormap or color attribute. Multiple alphas like in plot(alpha=0.2, color=(:red, 0.5)), will get multiplied.
clip_planes = @inherit clip_planes automatic — Clip planes offer a way to do clipping in 3D space. You can set a Vector of up to 8 Plane3f planes here, behind which plots will be clipped (i.e. become invisible). By default clip planes are inherited from the parent plot or scene. You can remove parent clip_planes by passing Plane3f[].
color = :speed — The coloring method for the trajectory
colormap = @inherit colormap :viridis — Sets the colormap that is sampled for numeric colors. PlotUtils.cgrad(...), Makie.Reverse(any_colormap) can be used as well, or any symbol from ColorBrewer or PlotUtils. To see all available color gradients, you can call Makie.available_gradients().
colorrange = automatic — The values representing the start and end points of colormap.
colorscale = identity — The color transform function. Can be any function, but only works well together with Colorbar for identity, log, log2, log10, sqrt, logit, Makie.pseudolog10, Makie.Symlog10, Makie.AsinhScale, Makie.SinhScale, Makie.LogScale, Makie.LuptonAsinhScale, and Makie.PowerScale.
cycle = [:color] — Sets which attributes to cycle when creating multiple plots. The values to cycle through are defined by the parent Theme. Multiple cycled attributes can be set by passing a vector. Elements can
directly refer to a cycled attribute, e.g.
:colormap a cycled attribute to a palette attribute, e.g.
:linecolor => :colormap multiple cycled attributes to a palette attribute, e.g.
[:linecolor, :markercolor] => :color
depth_shift = 0.0 — Adjusts the depth value of a plot after all other transformations, i.e. in clip space, where -1 <= depth <= 1. This only applies to GLMakie and WGLMakie and can be used to adjust render order (like a tunable overdraw).
fxaa = false — Adjusts whether the plot is rendered with fxaa (fast approximate anti-aliasing, GLMakie only). Note that some plots implement a better native anti-aliasing solution (scatter, text, lines). For them fxaa = true generally lowers quality. Plots that show smoothly interpolated data (e.g. image, surface) may also degrade in quality as fxaa = true can cause blurring.
highclip = automatic — The color for any value above the colorrange.
inspectable = @inherit inspectable — Sets whether this plot should be seen by DataInspector. The default depends on the theme of the parent scene.
inspector_clear = automatic — Sets a callback function (inspector, plot) -> ... for cleaning up custom indicators in DataInspector.
inspector_hover = automatic — Sets a callback function (inspector, plot, index) -> ... which replaces the default show_data methods.
inspector_label = automatic — Sets a callback function (plot, index, position) -> string which replaces the default label generated by DataInspector.
joinstyle = @inherit joinstyle — Controls the rendering at corners. Options are :miter for sharp corners, :bevel for "cut off" corners, and :round for rounded corners. If the corner angle is below miter_limit, :miter is equivalent to :bevel to avoid long spikes.
linecap = @inherit linecap — Sets the type of line cap used. Options are :butt (flat without extrusion), :square (flat with half a linewidth extrusion) or :round.
linestyle = nothing — Sets the dash pattern of the line. Options are :solid (equivalent to nothing), :dot, :dash, :dashdot and :dashdotdot. These can also be given in a tuple with a gap style modifier, either :normal, :dense or :loose. For example, (:dot, :loose) or (:dashdot, :dense).
For custom patterns have a look at Makie.Linestyle.
linewidth = @inherit linewidth — Sets the width of the line in screen units
lowclip = automatic — The color for any value below the colorrange.
miter_limit = @inherit miter_limit — Sets the minimum inner join angle below which miter joins truncate. See also Makie.miter_distance_to_angle.
model = automatic — Sets a model matrix for the plot. This overrides adjustments made with translate!, rotate! and scale!.
nan_color = :transparent — The color for NaN values.
overdraw = false — Controls if the plot will draw over other plots. This specifically means ignoring depth checks in GL backends
space = :data — Sets the transformation space for box encompassing the plot. See Makie.spaces() for possible inputs.
ssao = false — Adjusts whether the plot is rendered with ssao (screen space ambient occlusion). Note that this only makes sense in 3D plots and is only applicable with fxaa = true.
transformation = :automatic — Controls the inheritance or directly sets the transformations of a plot. Transformations include the transform function and model matrix as generated by translate!(...), scale!(...) and rotate!(...). They can be set directly by passing a Transformation() object or inherited from the parent plot or scene. Inheritance options include:
:automatic: Inherit transformations if the parent and childspaceis compatible:inherit: Inherit transformations:inherit_model: Inherit only model transformations:inherit_transform_func: Inherit only the transform function:nothing: Inherit neither, fully disconnecting the child's transformations from the parent
Another option is to pass arguments to the transform!() function which then get applied to the plot. For example transformation = (:xz, 1.0) which rotates the xy plane to the xz plane and translates by 1.0. For this inheritance defaults to :automatic but can also be set through e.g. (:nothing, (:xz, 1.0)).
transparency = false — Adjusts how the plot deals with transparency. In GLMakie transparency = true results in using Order Independent Transparency.
visible = true — Controls whether the plot gets rendered or not.
TimeseriesMakie.trajectory! Function
trajectory! is the mutating variant of plotting function trajectory. Check the docstring for trajectory for further information.