Tutorial
A walkthrough covering the most common operations: construct a series, compute a spectrum, resample, filter, plot. Most steps need only TimeseriesTools; the spectrum plot uses TimeseriesMakie and a Makie backend, and filtering/resampling load their respective extensions on demand.
Construct a time series
using TimeseriesTools, Unitful

t = range(0, 10; step = 0.01) * u"s"
x = Timeseries(sin.(2π * 5 * ustrip.(t)) .+ 0.3randn(length(t)), t) * u"V"
┌ 1001-element ToolsArray{Unitful.Quantity{Float64, 𝐋² 𝐌 𝐈⁻¹ 𝐓⁻³, Unitful.FreeUnits{(V,), 𝐋² 𝐌 𝐈⁻¹ 𝐓⁻³, nothing}}, 1} ┐
├──────────────────────────────────────────────────────────────────────── dims ┤
↓ 𝑡 Sampled{Unitful.Quantity{Float64, 𝐓, Unitful.FreeUnits{(s,), 𝐓, nothing}}} (0.0:0.01:10.0) s ForwardOrdered Regular Points
└──────────────────────────────────────────────────────────────────────────────┘
0.0 s 0.0395782 V
0.01 s 0.451425 V
0.02 s 1.06739 V
0.03 s 1.03727 V
0.04 s 1.21711 V
⋮
9.96 s -0.771344 V
9.97 s -0.715027 V
9.98 s -1.42258 V
9.99 s 0.0982456 V
10.0 s 0.05493 VThe result is a UnivariateTimeseries with a 𝑡 (time) dimension. Units flow through naturally: unit(eltype(x)) is V, unit(eltype(lookup(x, 𝑡))) is s.
samplingrate(x), duration(x)(100.0 s⁻¹, 10.0 s)Compute and plot a power spectrum
using CairoMakie, TimeseriesMakie

S = powerspectrum(x, 0.5)         # second argument: minimum frequency to resolve
fig = Figure()
ax = Axis(fig[1, 1])
plotspectrum!(ax, S)
fig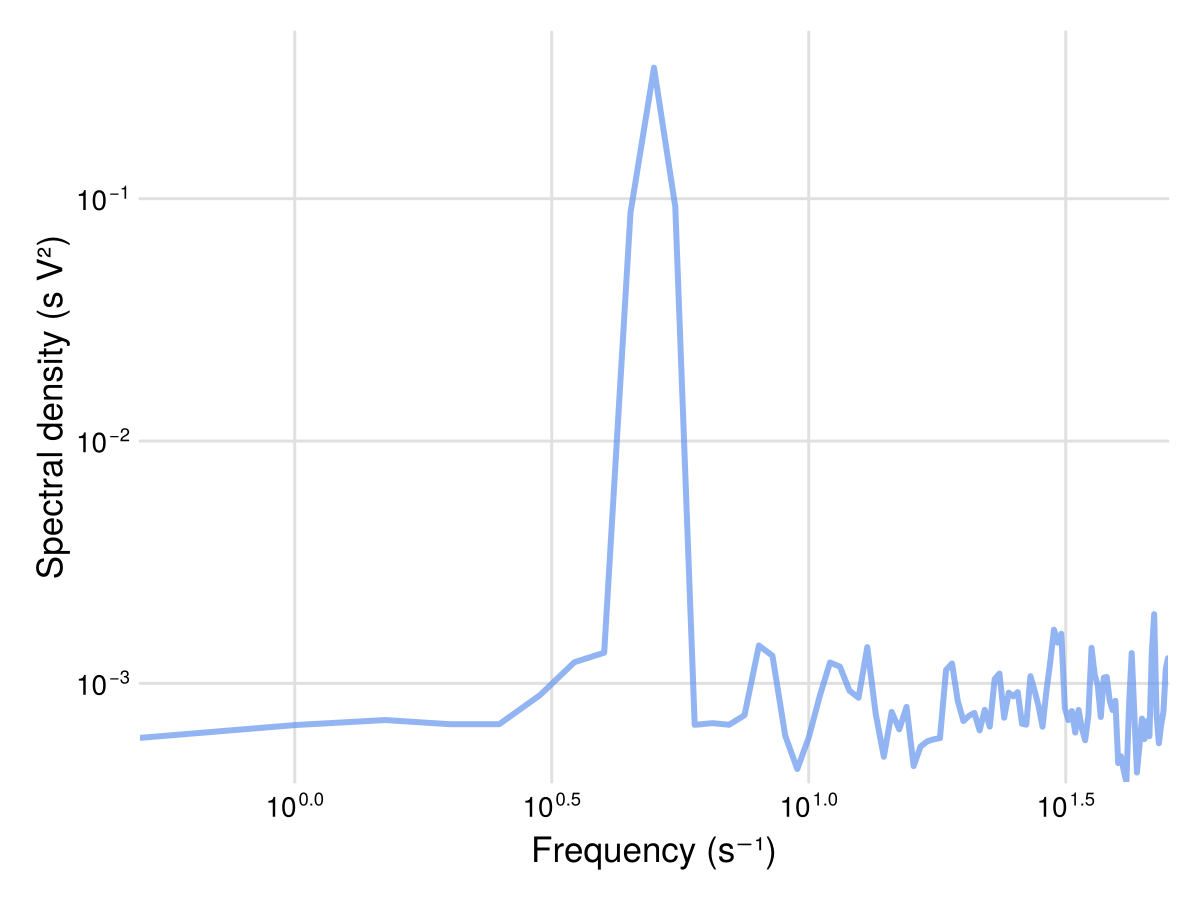
See Spectra and spectrograms for powerspectrum/energyspectrum options and the wavelet path.
Resample, upsample, downsample
resample evaluates an interpolant onto any target grid. upsample is the dense-target sugar; downsample (filter-then-decimate) is the only safe way to reduce a sampling rate.
using DataInterpolations    # enables interpolation/resampling

y_dense = upsample(x, 4)            # 4× the sampling density
y_grid = resample(x, 0.05u"s") # explicit periodusing DSP # enables downsample
y_slow = downsample(x, 5) # anti-alias filter, then decimate by 5
samplingrate(y_slow)See Data wrangling: imputation, interpolation, and resampling for the full table, including impute (NaN/missing fill) and N-dimensional joint fits.
Filter
xb = bandpass(x, [4u"Hz", 6u"Hz"]) # extracts the 5 Hz toneSee Filtering and analytic signals for bandpass/highpass/ lowpass, the Hilbert transform, instantaneous frequency/phase/amplitude, and phasestitch.
Next steps
Arrays and dimensions: the
ToolsArray/ToolsDimensiondata model.Utilities:
coarsegrain,buffer,window,delayembed, derivatives, circular statistics.Spike trains: point-process types, spike spectra,
stoic.Extensions reference: which
usingenables which capability.